This Darchive describe the search for a special type of star, RR Lyrae, in DES data. It is based on this paper: https://arxiv.org/abs/1905.00428
Most stars, like our Sun, emit nearly the same amount of light at all times (at least on human time scales) with only small variations. However, certain types of stars exist that vary their brightness significantly on short time scales. Two types of these stars, called RR Lyrae and Cepheid Variables, have well-studied repeating patterns of varying brightness. RR Lyrae cycle in brightness in less than a day, and are commonly found in globular clusters. Type I Cepheids have periods of less than 10 days, while type II Cepheids have periods of 10 to 100 days. These stars vary in brightness as they are constantly expanding and contracting in size (like a lung breathing in and out).
An incredibly useful fact about these variable stars is that their pulsation period is directly related to how intrinsically luminous they are. If we time the period of a variable star, we will know how bright it truly is, and then we can determine its distance away by comparing this value with how bright it appears to us on Earth. Stars like these with known intrinsic luminosity are called ‘standard candles’. Finding these standard candle variable stars is important for many cosmological studies that need accurate distances. Tracking RR Lyrae also helps in probing galaxy evolution, mapping black hole growth, and locating low-luminosity dwarf satellites in the Milky Way.
Since the Dark Energy Survey (DES) has deep and wide coverage of the night sky, it is a great resource to find very far away pulsating stars, even out to the Milky Way’s edges. DES can track the magnitude of each object (how bright the object appears) for long periods of time during the six years of survey operations. Graphs of an object’s brightness over time are called light curves. In DES, we have millions of light curves of many different types of objects, and we want to see which ones are periodic variable stars.
However, classification of variable stars is very difficult. In addition to brightness variations caused by the Earth’s atmosphere, there are other types of variable objects like eclipsing binaries and quasars, whose signals can masquerade as variable stars even though they are physically very different objects. We can narrow down the sources that we want by making cuts on specific traits of the source such as luminosity, period, color, and others. Making cuts is a tricky task, as too strict a cut will remove actual variable stars, but having no cuts will mean the data is littered with false positives. Also, DES observes such a wide area that the data collected for any particular object is often sparse and sampled unevenly in time. The light curves we have do not look like perfect sine curves where it would be easy to interpret the period. With the combination of a challenging data set with often only a few data points for a long period of time, it can be hard to write an algorithm to correctly interpret the data.
Katelyn Stringer and her co-authors tackle this problem in this recent paper. Stringer uses a combination of template fitting and machine learning to try to solve the problem. The template fitting algorithm, developed by statistics professor James Long, stretches an RR Lyrae signal pattern to match the light curve data. Then, the authors train a machine learning algorithm on how well the pattern matched the data to predict if the object is an RR Lyrae or not.
Machine learning is where a computer is trained or learns on its own to analyze data and uses that knowledge to make assumptions about future data that comes its way. Machine learning is very common in the modern everyday world–it’s how Netflix knows what tv shows you might want to watch next or how Siri recognizes your voice commands. In many cases, machine learning can perform better than a scientist alone because the algorithm can find relationships between seemingly unrelated aspects of the data and can make decisions much faster than an individual person can.
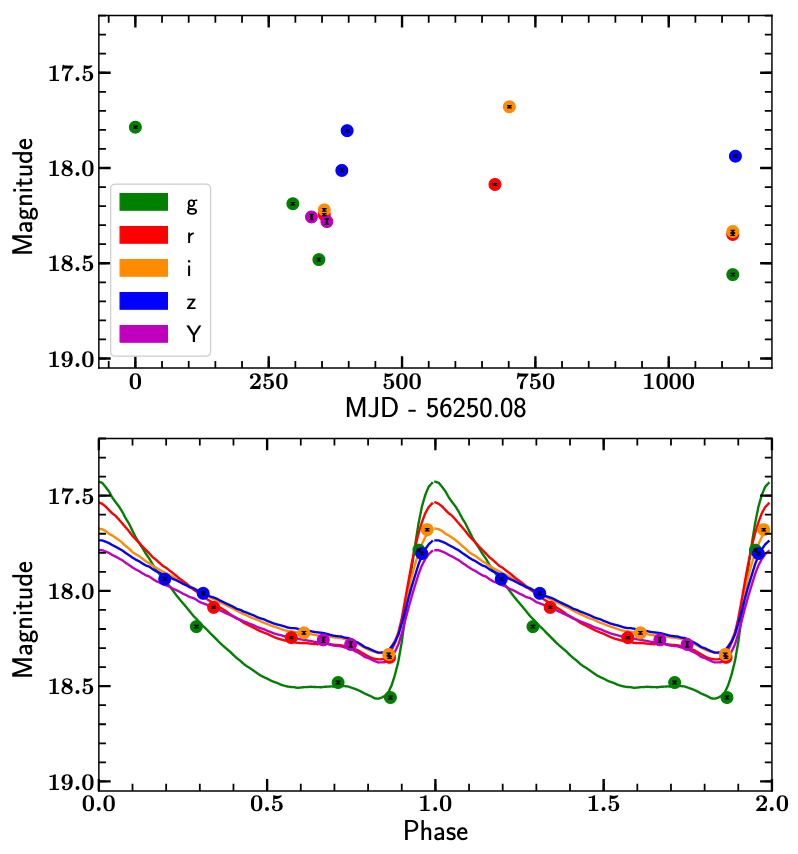
Figure 1: (Top) Observations of a candidate RR Lyrae star by DES. The x-axis is number of days since the first observation (with the first observation’s Modified Julian Date shown). The y-axis shows brightness of the star by magnitude, where smaller magnitudes (top of plot) are brighter. Each color is a different color band observed by DES. The variations with time in each band can be seen, though the sparse sampling in time makes distinguishing the period of variability difficult. (Bottom) Stringer et al’s machine learning-derived models of the full period of brightness variability. The modeled period is found to match the more complete observations by other telescopes.
In this work, Stringer trained a Random Forest Classifier. This type of machine learning algorithm is like collecting information from many simultaneous games of 20 questions; a bunch of ‘random’ questions are tried to figure out which characteristics correlate with being or not being a RR Lyrae, and which ones do not. The algorithm was trained with a set of known RR Lyrae and non-RR Lyrae. After the learning phase, the machine algorithm was tested on a new set of data of objects with unknown classifications. The algorithm decided if each object was an RR-Lyrae or a non-RR Lyrae based on the information it learned from the previous data.
Despite the challenges of the sparse DES data set, Stringer and her co-authors were able to successfully identify thousands of RR Lyrae. Figure 1 shows an example of a real RR Lyrae light curve pattern as observed by DES. The observations were taken through five different color filters, g,r,i,z,Y , which represent different regions of the light spectrum, spanning visible and infrared wavelengths of light. On the bottom panel of Figure 1, we see that the RR Lyrae template pattern matches the data very well, as expected for a real RR Lyrae. They identified 5783 RR Lyrae candidates of which 28% were previously undiscovered (see Figure 2). In particular, the DES scientists found some of the most distant RR Lyrae in the Milky Way to date, over 200 kpc away.
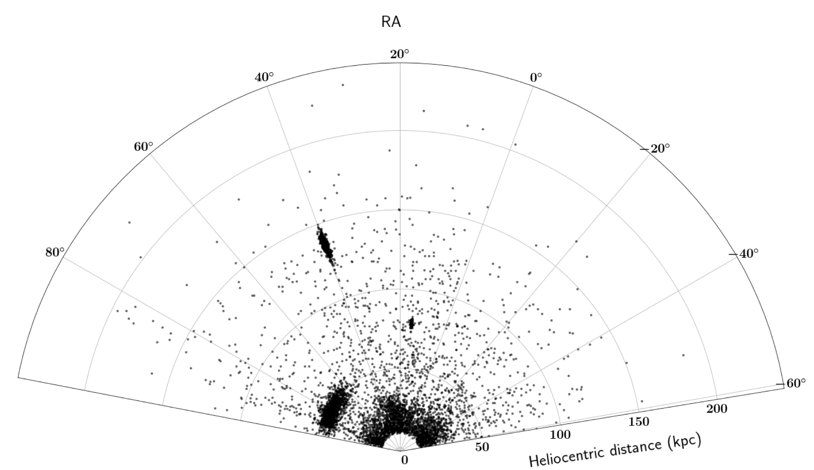
Figure 2: The 5783 RR Lyrae candidates found in three years of DES data by Stringer et al. The RR Lyrae are plotted by Right Ascension direction and distance from our Sun. The clumps represent some known dwarf galaxies, including the Large Magellanic Cloud in the direction of RA=80 degrees.
The future is bright for scientists studying these variable stars. Stringer’s work only used the first three years of DES data, but soon, scientists will have three more years of DES data to use for improving algorithms and identifying more variable stars. Another challenge is creating methods that can sort multiple types of variable stars. By building scripts to categorize multiple types of variable stars at once, DES will be able to build large collections with lots of variety to study different types of variable stars more quickly, and eventually build statistical samples of even the rarest objects.
In a few years, we will have access to the Large Synoptic Survey Telescope (LSST) which will collect data on a larger fraction of the night sky and with less sparse data. In its early stages, it is vital that there are scripts put in place to identify and sort found objects so that LSST can identify new types of objects as well.
DArchive Author: Jen Locke
 Jen is a rising sophomore and undergraduate researcher at the University of Pennsylvania. Her main interests are studying variable stars and trans-Neptunian objects (TNOs). She is leading her own project on categorizing variable stars–specifically quasars, RR Lyrae, cepheids, and eclipsing binaries–from Dark Energy Survey (DES) data.
Paper Author: Katelyn Stringer
 Katelyn is an astronomy PhD candidate at Texas A&M University where she studies variable stars and explores new ways to identify them. When she isn’t working on astronomy or data science, she loves to read, play video games with her friends, and dance.
DArchive Editor: Ross Cawthon
 Ross is a postdoctoral researcher at the University of Wisconsin-Madison. He works on various projects studying the large-scale structure of the Universe using the millions of galaxies DES observes. These projects include galaxy clustering, correlations of structure with the cosmic microwave background and using the structure of the Universe to infer the redshifts of galaxies. Ross also coordinates Education and Public Outreach efforts in DES, including managing the darchives and social media.