Our year 3 cosmology analysis of galaxy clustering and gravitational lensing is a massive effort from more than one hundred scientists. There are 31 interconnected papers in all, with the main cosmology analysis, and an ‘extended models’ analysis, at the bottom of the page.
Read a press release from May 27, 2021 about this Year 3 analysis, including a 7-minute video featuring our scientists: https://news.fnal.gov/2021/05/dark-energy-survey-releases-most-precise-look-at-the-universes-evolution/
Spanish translation of press release: Link
Portuguese translation of press release: Link
Italian translation of press release: Link
Watch a webinar from May 27, 2021 about this Year 3 analysis: https://www.youtube.com/watch?v=8aHbLMUOwLc
We’ve released some of the Y3 Cosmology data products on this page: https://des.ncsa.illinois.edu/releases/y3a2
For questions, you can email lead authors, or thedarkenergysurvey@gmail.com.
For a public-level overview of some of these papers, check out the the Darchives.
Catalogs
Dark Energy Survey Year 3 Results: Photometric Data Set for Cosmology
Authors: I. Sevilla-Noarbe (nsevilla@gmail.com), K. Bechtol (kbechtol@wisc.edu), M. Carrasco Kind, et al.
Link to paper(arXiv) Link to paper(ApJ)
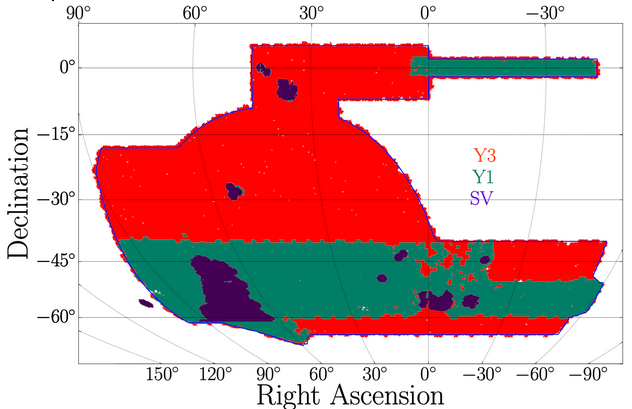
We describe the Dark Energy Survey (DES) photometric data set assembled from the first three years of science operations to support DES Year 3 cosmology analyses, and provide usage notes aimed at the broad astrophysics community. This Y3 “GOLD” catalog comprises nearly 5000 deg2 of grizY imaging in the south Galactic cap, including nearly 390 million objects, with depth reaching S/N∼10 for extended objects up to i ∼ 23.0.
Figure: Footprint of the DES Y3 Gold data (red) with DES Y1 (green) and SV (purple) overlaid.
Dark Energy Survey Year 3 Results: Deep Field Optical + Near-Infrared Images and Catalogue
Authors: W.G. Hartley (william.hartley@unige.ch), A. Choi (choi.1442@osu.edu), A. Amon (amon2018@stanford.edu), R. A. Gruendl, E. Sheldon, I. Harrison, G. M. Bernstein, I. Sevilla-Noarbe, B. Yanny, K. Eckert, H. T. Diehl et al.
Link to paper(arXiv) Link to paper(MNRAS)
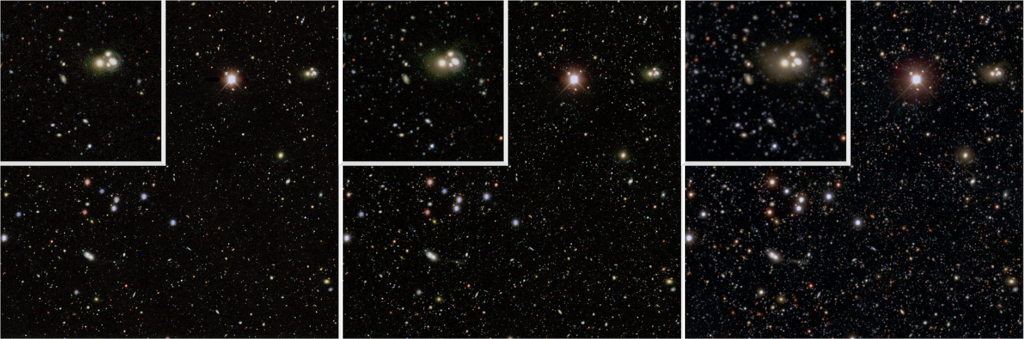
We describe the Dark Energy Survey (DES) Deep Fields, a set of images and associated multi-wavelength catalogue (ugrizJHKs) built from Dark Energy Camera (DECam) and Visible and Infrared Survey Telescope for Astronomy (VISTA) data. We present a catalogue for the DES 3-year cosmology analysis of a subset of four fields with full 8-band coverage, with i-band depth of 25. The total unmasked area of 5.88 sq. deg. yields 1.6 million objects that are subsequently used in various parts of the DES 3-year weak lensing and galaxy clustering cosmology work such as the source galaxy redshift distributions (see Myles & Alarcon et al.), shear calibration simulations (see MacCrann et al.), and simulations of the survey transfer function (see Everett et al.). The galaxies will also be used as effectively noiseless templates (S/N>sqrt(10) x wide-survey galaxies) for shear measurements using the Bayesian Fourier Domain methodology (see Bernstein & Armstrong 2014). Beyond underpinning the Y3KP cosmology analysis, these data will also enable a wide variety of galaxy evolution studies.
Figure: Color image of approximately half of a DECam chip made from the grz filters at three different depths. The inset squares are a factor of 2 zoom-in of the interacting group located to the far right of the main image.
Dark Energy Survey Year 3 Results: Measuring the Survey Transfer Function with Balrog
Authors: S. Everett (sweverett@ucsc.edu), B. Yanny, N. Kuropatkin, E. Huff, Y. Zhang et al.
Link to paper(arXiv) Link to paper(ApJ)
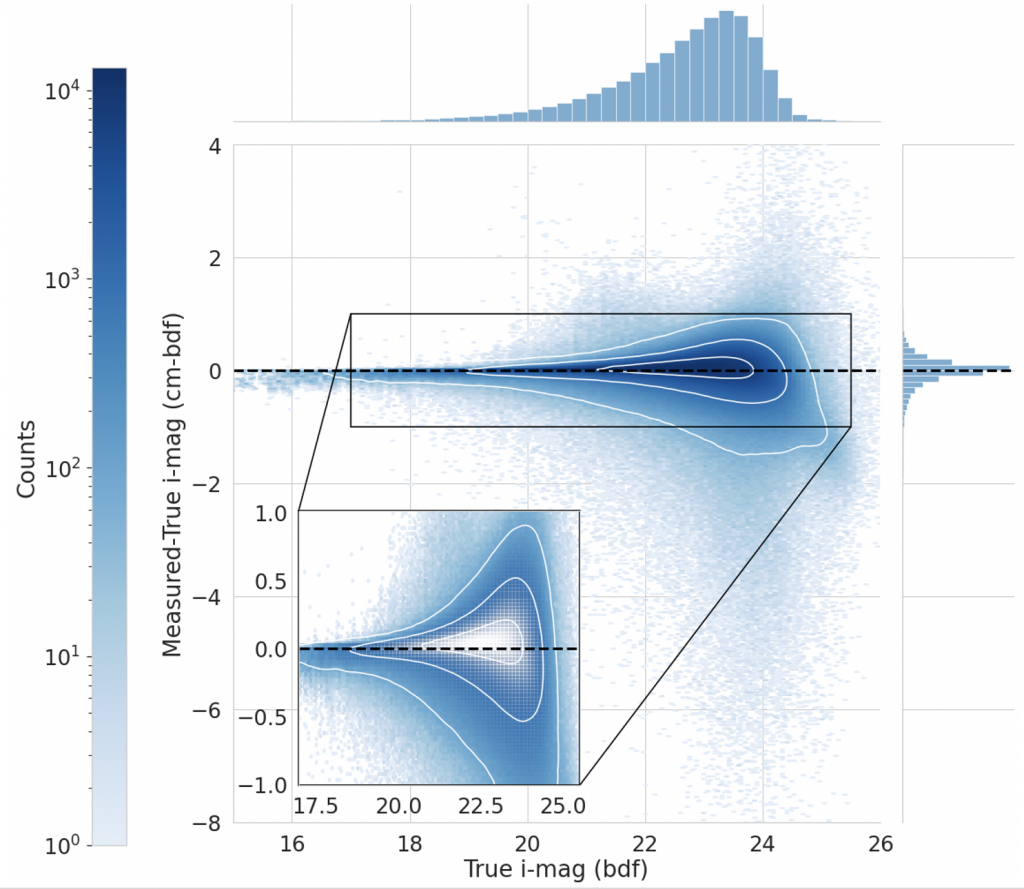
We describe an updated calibration and diagnostic framework, Balrog, used to directly sample the selection and photometric biases of Dark Energy Survey’s (DES) Year 3 (Y3) dataset. We systematically inject onto the single-epoch images of a random 20% subset of the DES footprint an ensemble of nearly 30 million realistic galaxy models derived from DES Deep Field observations (see Hartley & Choi et al.). These augmented images are analyzed in parallel with the original data to automatically inherit measurement systematics that are often too difficult to capture with traditional generative models. The resulting object catalog is a Monte Carlo sampling of the DES transfer function and is used as a powerful diagnostic and calibration tool for a variety of DES Y3 science, particularly for the calibration of the photometric redshifts of distant “source” galaxies and magnification biases of nearer “lens” galaxies (see Myles & Alarcon et al.).
Figure: This figure shows the distribution of differences in recovered vs. injected i-band magnitude for Balrog galaxies as a function of the injected magnitude after basic science sample cuts. While ~99% of injections have magnitude responses that are contained within the third white contour (highlighted in the inset), there are long, non-Gaussian tails that capture many of the complex features of the DES measurement pipeline such as the effects from image artifacts, blending with other astronomical sources, and catastrophic modeling errors. This displays a narrow slice of the full DES transfer function which characterizes all of the selection and photometric biases of the survey’s measurements of the true cosmic signals in the sky.
Dark Energy Survey Year 3 Results: Weak Lensing Shape Catalogue
Authors: M. Gatti (mgatti@ifae.es), E. Sheldon (erin.sheldon@gmail.com), A. Amon, M. Becker, M. Troxel, A. Choi, C. Doux, N. MacCrann, A. Navarro Alsina, I. Harrison, D. Gruen, G. Bernstein, M. Jarvis, L. F. Secco, A. Ferte, T. Shin, J. McCullough, R. P. Rollins, R. Chen, C. Chang, S. Pandey, I. Tutusaus, J. Prat, J. Elvin-Poole, C. Sanchez, et al.
Link to paper(arXiv) Link to paper(MNRAS)
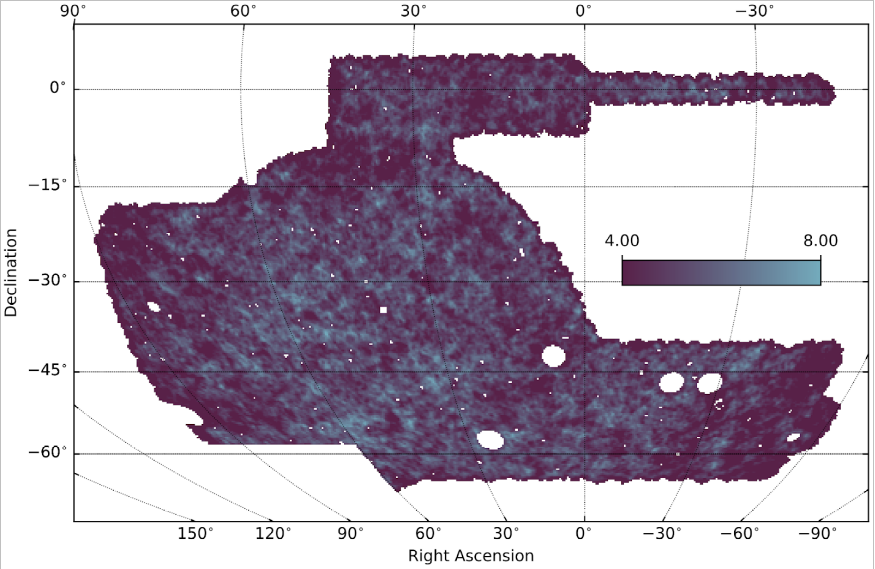
We present and characterise the galaxy shape catalogue of DES Y3. Our self-calibrating shear measurement pipeline metacalibration builds and improves upon the pipeline used in the DES Year 1 analysis in several aspects. The final shape catalogue consists of 100,204,026 galaxies, measured in the riz bands, resulting in a weighted source number density of neff=5.59gal/arcmin2 and corresponding shape noise σe=0.261. We perform a battery of internal null tests on the catalogue, including tests on systematics related to the point-spread function (PSF) modelling, spurious catalogue B-mode signals, catalogue contamination, and galaxy properties to show that this catalog is ready for weak lensing cosmology.
Figure: Effective density of weak lensing sources in the DES Y3 metacalibration shape catalog, across the full footprint.
Dark Energy Survey Year 3 Results: Point-Spread Function Modeling
Authors: M. Jarvis (mjarvis@physics.upenn.edu), G. M. Bernstein, A. Amon, C. Davis, P. F. Léget, K. Bechtol, I. Harrison, M. Gatti, A. Roodman, et al.
Link to paper (arXiv) Link to paper (MNRAS)
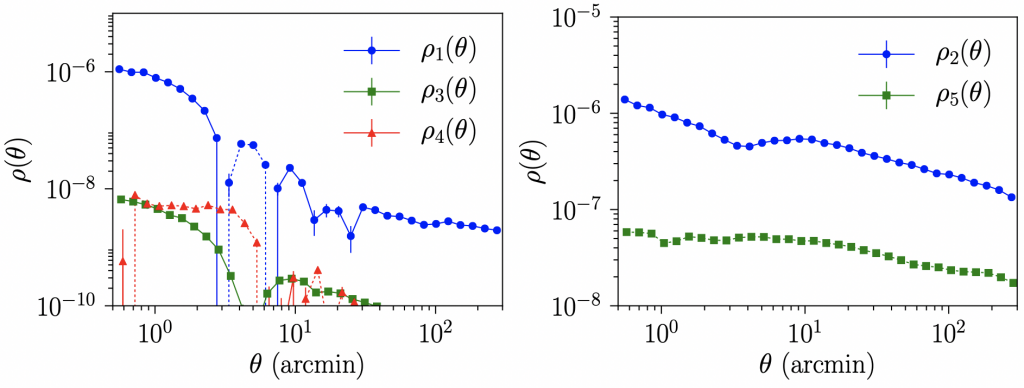
We introduce a new software package for modeling the point-spread function (PSF) of astronomical images, called PIFF, which we apply to DES Y3. We describe the relevant details about the algorithms used by PIFF to model the PSF, including how the PSF model varies across the field of view. Diagnostic results show that the systematic errors from the PSF modeling are very small over the range of scales that are important for the DES Y3 weak lensing analysis. In particular, the systematic errors from the PSF modeling are significantly smaller than the corresponding results from the DES Y1 analysis. We also briefly describe some planned improvements to PIFF that we expect to further reduce the modeling errors in future analyses.
Figure: The rho statistics are the principal diagnostic we use to establish the quality of the PSF model, since they contribute directly as an additive systematic error in the cosmic shear correlation functions. There are 5 statistics presented in these two figures, which are all demonstrated to be small enough not to significantly bias the DES Y3 cosmology analysis. Other statistics are presented in the paper.
Calibration
DES Y3 results: Blending shear and redshift biases in image simulations
Authors: N. MacCrann (nm746@cam.ac.uk), M. R. Becker, J. McCullough, A. Amon, D. Gruen, M. Jarvis, A. Choi, M. A. Troxel, E. Sheldon, B. Yanny, K. Herner, S. Dodelson, J. Zuntz et al.
Link to paper(arXiv) Link to paper(MNRAS)
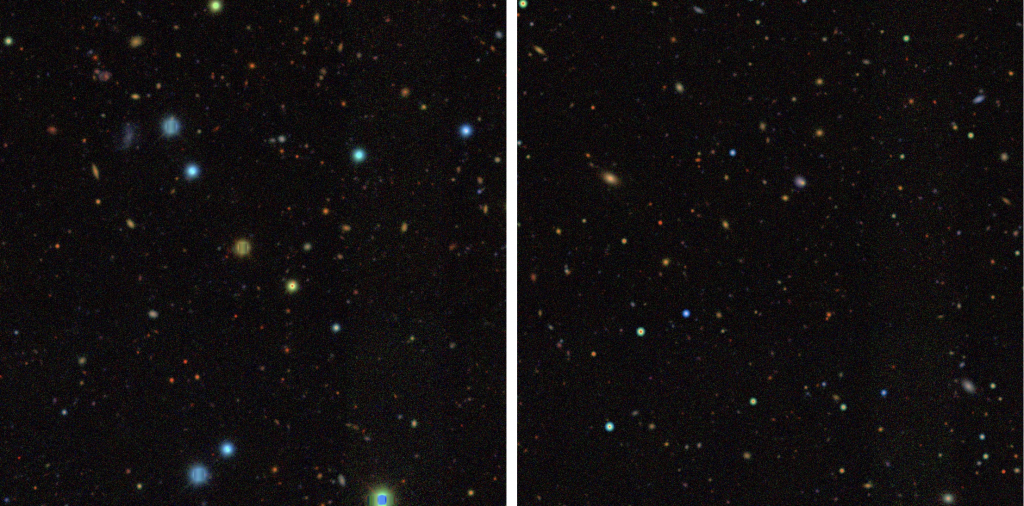
We characterize and provide calibration for the gravitational lensing lensing shear measurement pipeline used on the DES Year 3 data. This requires highly detailed and realistic simulations of the DES images, in which we inject artificial shear signals. By analysing our recovery of these injected signals, we can quantify the small but significant biases present in our estimation of the shear, due to subtle effects like blending of multiple galaxies, and derive corrections to be used in the weak lensing cosmology analyses. We derive a new formalism for including the effects of blending in the effective redshift distribution for weak lensing, which allows for a single detected object to contribute to multiple redshifts in the theoretical predictions of weak lensing statistics. Such an approach will become essential for upcoming, deeper datasets, where there will be increased blending and stricter accuracy requirements, such as the Rubin Observatory LSST.
Figure: A color image of a 1000 x 1000 pixel region of the same coadd tile for the real DES Year 3 data (left panel) and our fiducial simulation (right panel). The realistic joint distributions of observed galaxy morphology, flux and colors allows for a joint characterization of the impact of blending on the shear calibration and the effective redshift distribution.
Phenotypic redshifts with self-organizing maps: A novel method to characterize redshift distributions of source galaxies for weak lensing
Authors: R. Buchs (romainbuchs@hotmail.com), C. P. Davis, D. Gruen, J. DeRose, A. Alarcon, G. M. Bernstein, C. Sanchéz, J. Myles, A. Roodman, et al.
Link to paper (arXiv) Link to paper (MNRAS)
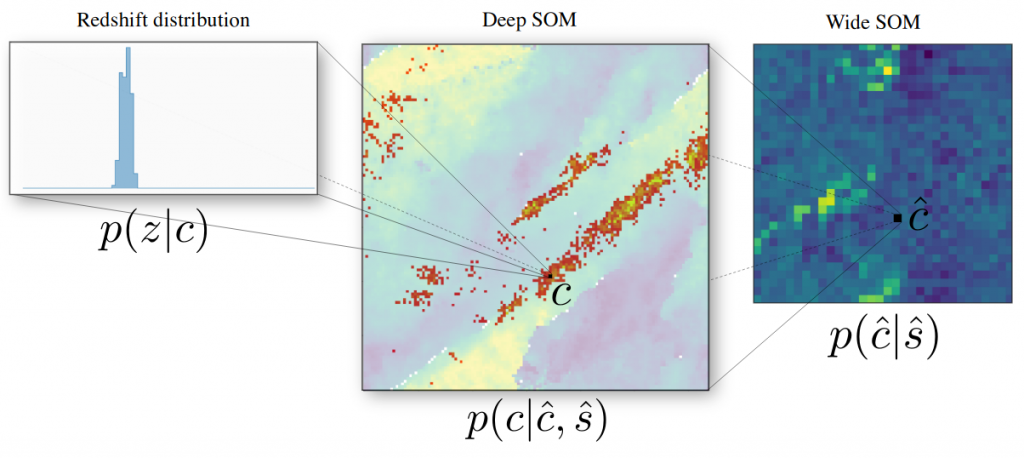
We introduce a new method of linking information from spectroscopy or other high-quality redshift estimates to wide field weak lensing source samples via photometric multi-band deep fields. Using mock catalogs, we show that this significantly reduces sample variance in redshift calibration. This methodology is at the same time a key to being able to use spectroscopic information for calibration of DES photometric redshifts without dominant selection biases.
Figure: Deep field multi-band photometry acts as an intermediary between redshift information and wide-field galaxy samples whose redshift distributions we calibrate.
Dark Energy Survey Year 3 Results: Redshift Calibration of the Weak Lensing Source Galaxies
Authors: J. Myles (jmyles@stanford.edu), A. Alarcon (alexalarcongonzalez@gmail.com), A. Amon, C. Sanchez, S. Everett, J. DeRose, J. McCullough, D. Gruen, G. Bernstein, M. Troxel, S. Dodelson, A. Campos, N. MacCrann, B. Yin, M. Raveri et al.
Link to paper(arXiv) Link to paper(MNRAS)
We present the derivation and validation of redshift distributions for the source galaxies used in the DES Y3 weak lensing measurements. As the first application of this method to data, we validate that the assumptions made apply to the DES Y3 weak lensing source galaxies and describe our treatment of systematic uncertainties. In a first for redshift analyses, we construct an ensemble of redshift distributions whose variation encodes all uncertainties and combines information from galaxy color, position correlation functions, and shear ratios.
Figure: Ensemble of redshift distributions in four tomographic bins, as inferred from galaxy photometry. Each symbol shows the 95% credible interval of the probability of a galaxy in the weak lensing source sample and assigned to a given tomographic bin to have redshift z. The uncertainty on p(z) is due to biases in the secure redshifts used in the analysis, sample variance and shot noise in the galaxies in the DES deep fields, photometric calibration uncertainty for the DES deep fields, and the inherent uncertainty of the methods applied.
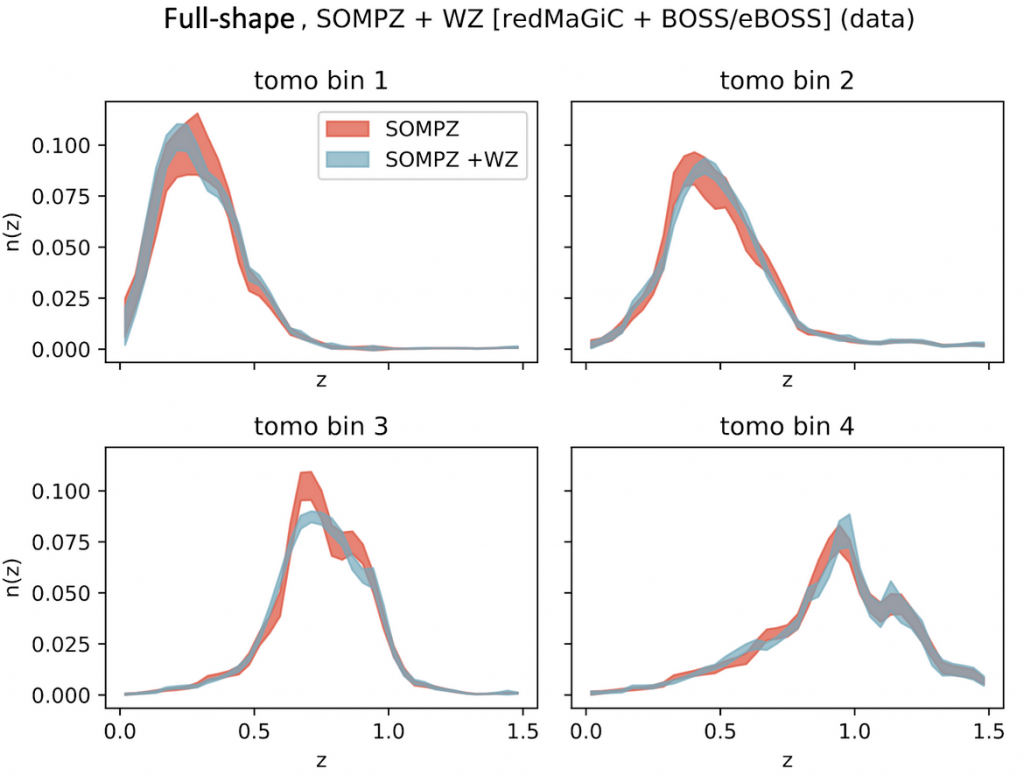
Dark Energy Survey Year 3 Results: Clustering Redshifts — Calibration of the Weak Lensing Source Redshift Distributions with redMaGiC and BOSS/eBOSS
Authors: M. Gatti (mgatti@ifae.es), G. Giannini (ggiannini@ifae.es), G. M. Bernstein, A. Alarcon, J. Myles, A. Amon, R. Cawthon, M. Troxel, J. DeRose, S. Everett, A. J. Ross, E. S. Rykoff , J. Elvin-Poole, J. Cordero, I. Harrison, C. Sanchez, J.Prat, D.Gruen, H. Lin, M. Crocce, E. Rozo et al.
Link to paper(arXiv) Link to paper(MNRAS)
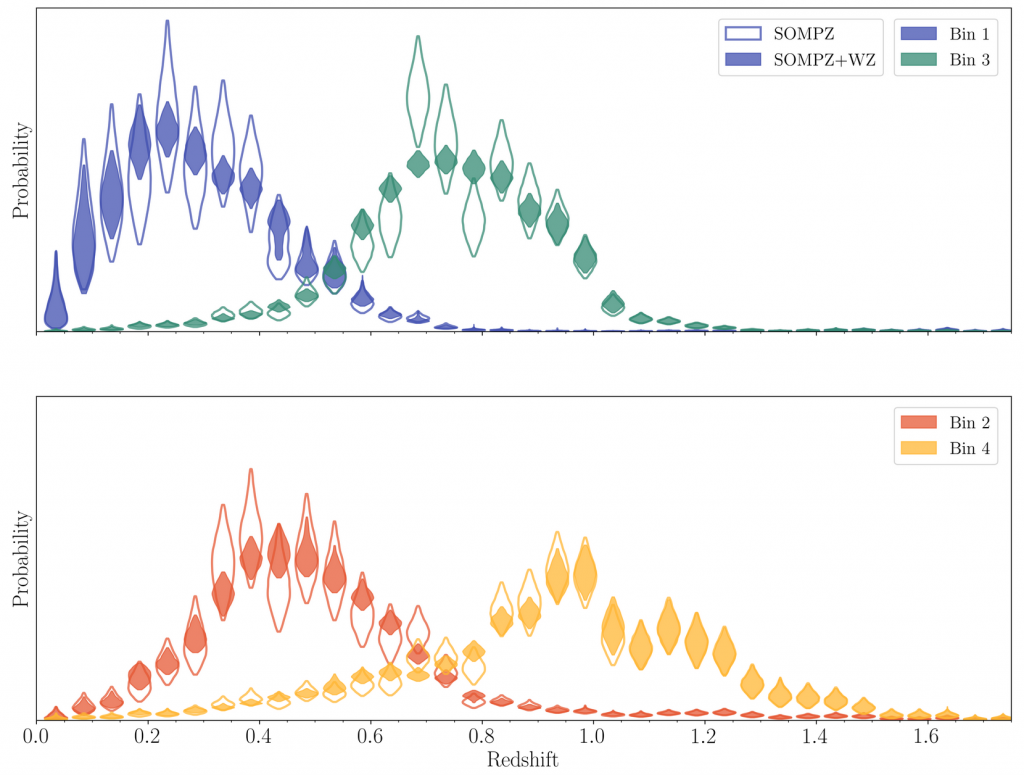
We present the calibration of the Dark Energy Survey Year 3 (DES Y3) weak lensing source galaxy redshift distributions n(z) from clustering measurements, cross-correlating the weak lensing (WL) source galaxies sample with redMaGiC galaxies and BOSS/eBOSS galaxies. Two distinct methods for using the clustering statistics are described. The first uses the clustering information independently to estimate the mean redshift of the source galaxies within a redshift window, as done in the DES Y1 analysis. The second method establishes a likelihood of the clustering data as a function of n(z), which can be incorporated into schemes for generating samples of n(z) subject to combined clustering and photometric constraints. We apply the two methods to the DES Y3 data, and compare the clustering based constraints with the fiducial DES photometric redshift estimates.
Figure: SOMPZ redshift distributions, as estimated in data, with and without clustering information (full-shape method). The bands encompass the statistical and systematic uncertainties of the distributions. Sampling from the joining posterior greatly reduces the point-by-point uncertainties in n(z), just as in the simulations. The clustering full-shape method is thus very successful at reducing the impact sample variance on SOMPZ estimators.
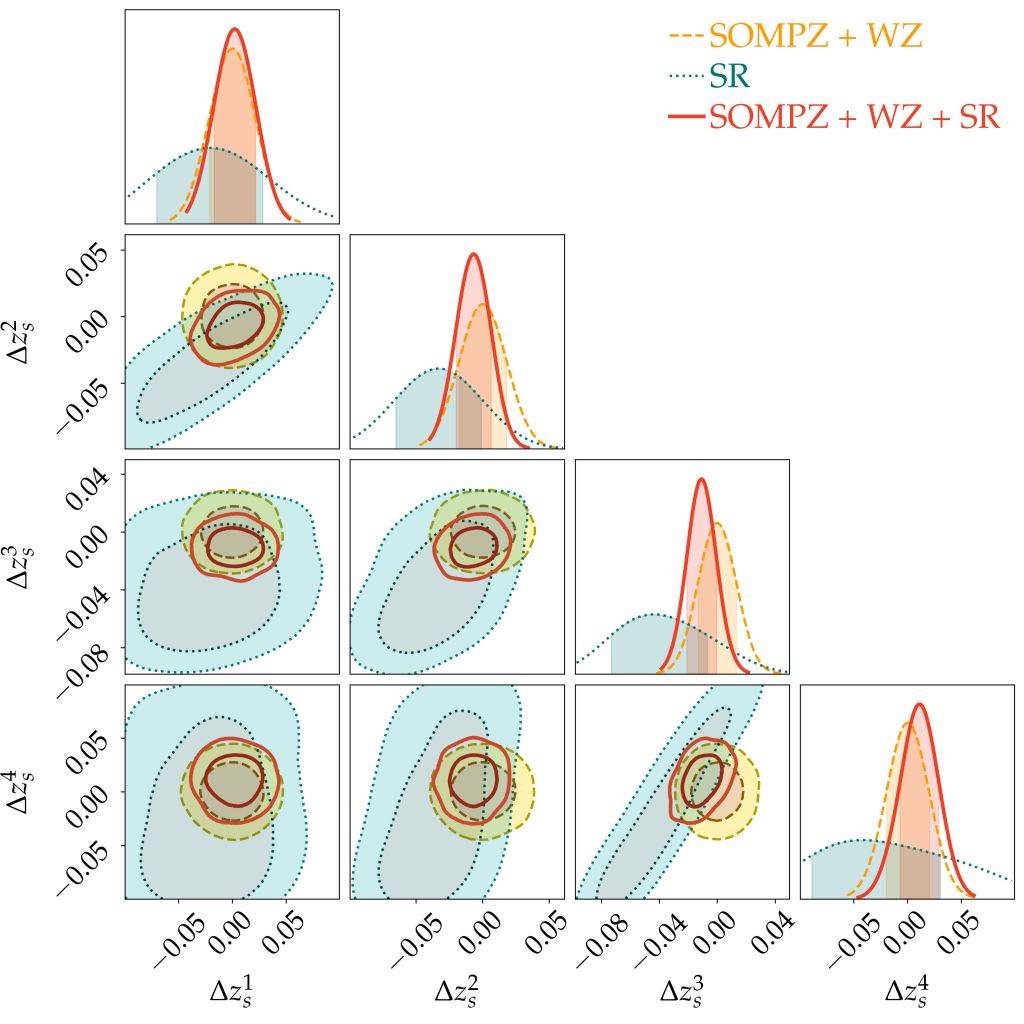
Dark Energy Survey Year 3 Results: Exploiting small-scale information with lensing shear ratios
Authors: C. Sánchez (carles.sanchez.alonso@gmail.com), J. Prat (jpratmarti@gmail.com), G. Zacharegkas, S. Pandey, E. Baxter, G. M. Bernstein, J. Blazek, R. Cawthon, C. Chang, E. Krause, P. Lemos, Y. Park, M. Raveri, J. Sanchez, M. A. Troxel, A. Amon, X. Fang, O. Friedrich, D. Gruen, A. Porredon, L. F. Secco, S. Samuroff et al.
Link to paper(arXiv) Link to paper(PRD)
Using the first three years of data from DES, we use ratios of small-scale galaxy-galaxy lensing measurements around the same lens sample to constrain source redshift uncertainties, intrinsic alignments and other systematics or nuisance parameters of our model. Instead of using a simple geometric approach for the ratios as has been done in the past, we use the full modeling of the galaxy-galaxy lensing measurements, including the corresponding integration over the power spectrum and the contributions from intrinsic alignments and lens magnification. We perform extensive testing of the small-scale shear ratio (SR) modeling by studying the impact of different effects such as the inclusion of baryonic physics, non-linear biasing, halo occupation distribution (HOD) descriptions and lens magnification, among others, and using realistic N-body simulations of the DES data. For source redshifts, SR improves the constraints by up to 38% in some redshift bins. Such improvements translate to tighter cosmological constraints when shear ratios are combined with cosmic shear and other 2pt functions. For the DES Y3 data, SR improves S8 constraints from cosmic shear by up to 31%, and for the full combination of probes (3x2pt) by up to 10%.
Figure: Constraints on the mean of the source redshift distributions in the DES Y3 analysis. The yellow contours show the constraints from photometry and clustering redshifts (SOMPZ + WZ), the blue contours show the constraints from shear ratios (SR), and the red contours show the combination of these three methods.
Dark Energy Survey Year 3 results: Marginalisation over redshift distribution uncertainties using ranking of discrete realisations
Authors: J.P. Cordero (juan.cordero@postgrad.manchester.ac.uk), I. Harrison (ian.harrison-2@manchester.ac.uk), R.P. Rollins, G.M. Bernstein, S.L. Bridle et al.
Link to paper(arXiv) Link to paper(MNRAS)
We present hyperrank, a new method for marginalising over redshift distribution uncertainties in cosmological analyses, using discrete samples from the space of all possible redshift distributions. In hyperrank the set of proposed redshift distributions is ranked according to a small number of summary values, which are then sampled along with other nuisance parameters and cosmological parameters in the Monte Carlo chain used for inference. We focus on the case of weak lensing cosmic shear analyses and demonstrate our method using simulations made for the Dark Energy Survey (DES). We show the method can correctly and efficiently marginalise over a range of models for the redshift distribution uncertainty. We compare hyperrank to the common mean-shifting method of marginalising over redshift uncertainty and validate it for use in the DES Year 3 cosmology results.
Figure: Left shows the standard marginalization, where mean redshift uncertainty is sampled from a parametric prior distribution. Right shows the approach employed by Hyperrank, where proposal n(z) realisations are ranked and mapped to a hyperparameter which is then sampled to select one of the samples on the MCMC chain.
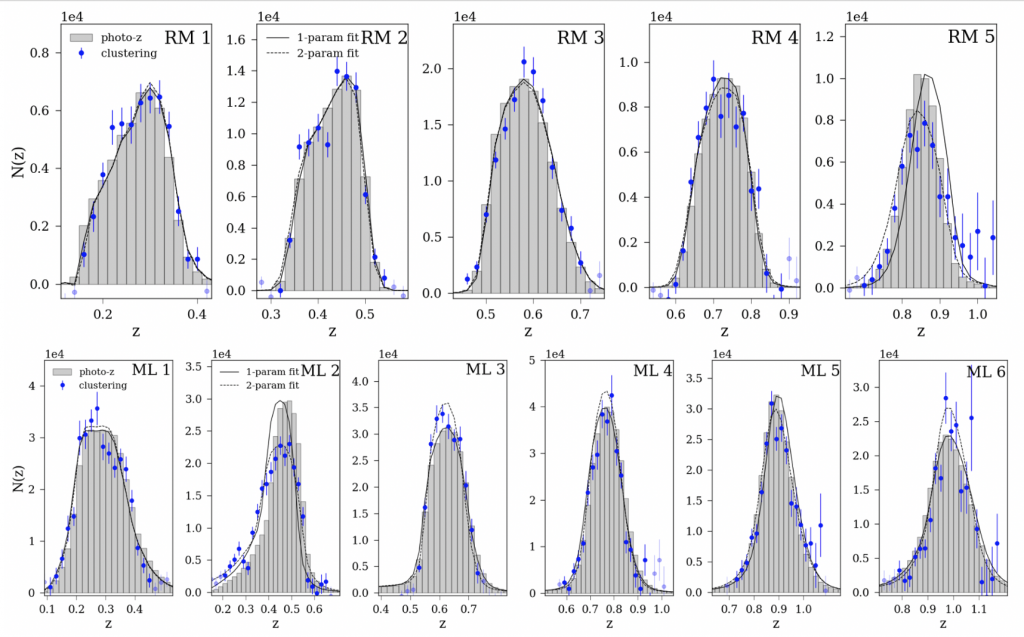
Dark Energy Survey Year 3 Results: Calibration of Lens Sample Redshift Distributions using Clustering Redshifts with BOSS/eBOSS
Authors: R. Cawthon (rcawthon28@gmail.com), J. Elvin-Poole, A. Porredon, M. Crocce, G. Giannini, M. Gatti, A. J. Ross, E.S. Rykoff, A. Carnero Russell, J. DeRose, S. Lee, M. Rodriguez-Monroy et al.
Link to paper(arXiv) Link to paper(MNRAS)
This work describes the calibration of ‘lens’ galaxy redshifts in DES. In a method called ‘clustering redshifts’, we measure angular cross-correlations between DES galaxies and spectroscopic galaxies from the BOSS & eBOSS surveys. The signal from these correlations informs us about the redshift distribution, N(z), of the DES galaxies. We test and validate a new procedure to mitigate the ‘galaxy bias systematic’ error in this method. We constrain the mean and width of redshift distributions in eleven different photometrically-selected bins. We find biases on the mean redshift in most cases to be below |0.01|. Our uncertainties on the mean redshift range from 0.003 to 0.008 and our uncertainties on the width range from 4 to 9%. We discuss how these results calibrate the redshift distributions used in companion DES Year-3 papers.
Figure: The clustering redshift measurements for the eleven lens galaxy bins, five from the Redmagic sample, and six from the magnitude-limited (maglim) sample. Also shown are the photometric redshift estimates, and 1- and 2-parameter fits to the clustering data. In the 1-parameter fit, the photo-z is shifted to match the mean redshift measured by clustering. In the 2-parameter fit, the photo-z is shifted and stretched to fit the clustering data.
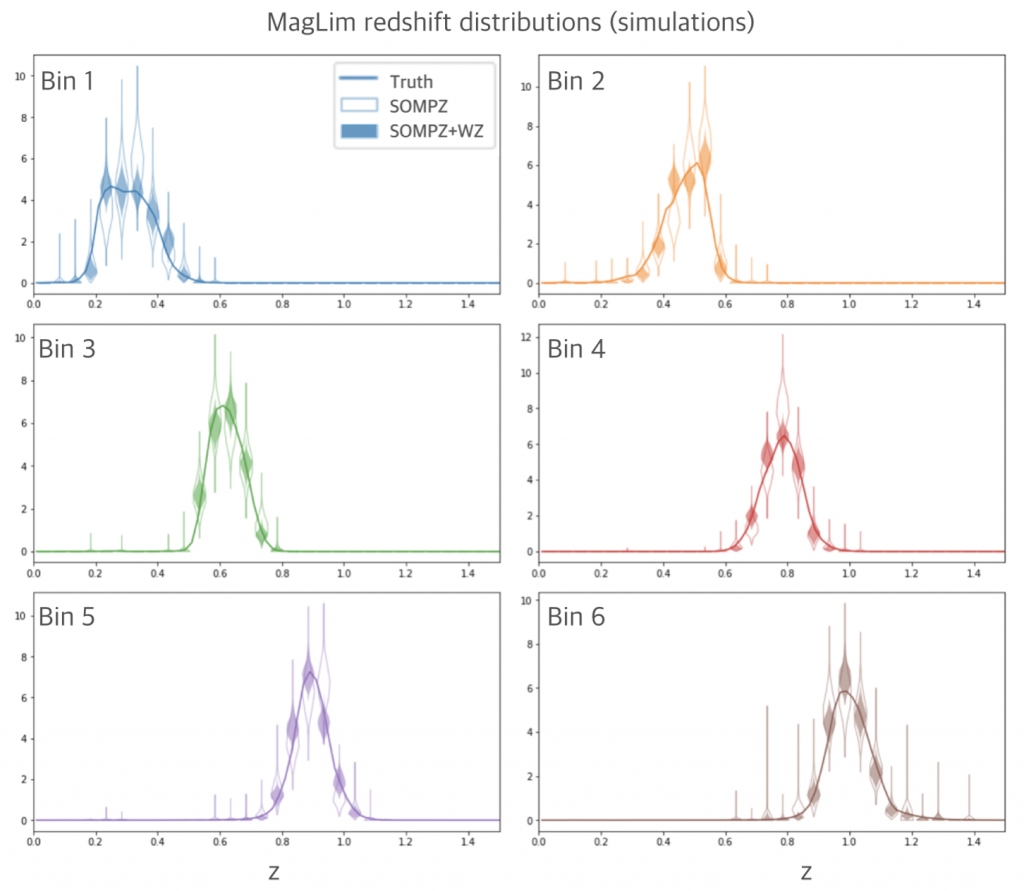
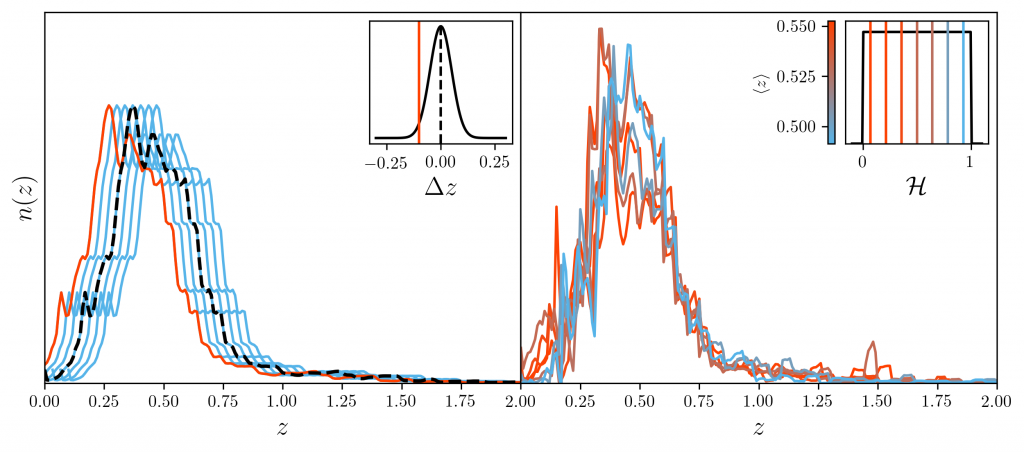
Dark Energy Survey Year 3 Results: Redshift Calibration of the MagLim Lens Sample using Self-Organizing Maps and Clustering Redshifts
Authors: G. Giannini (ggiannini@ifae.es), A. Alarcon, R. Cawthon, J. Myles, M. Gatti, A. Porredon, J. Elvin-Poole, M. Crocce, J. Cordero, I. Harrison et al.
Link to paper (arXiv)
Biased redshift calibration is one of the limiting factors of wide-field imaging surveys. In this work we apply a novel redshift calibration method to the MagLim galaxy sample, exploiting the information in the DES deep fields as an intermediate step to break the degeneracy of color-redshift. This is achieved by classifying all the galaxies in phenotypes according to their observed fluxes, using self-organising maps. The method has been tested in N-body simulation and the uncertainty introduced by sample variance and shot noise is estimated using a theoretical 3sDIR method. The result is then combined through a Hierarchical MonteCarlo with the estimates from cross correlations using eBOSS/BOSS galaxies as reference, which independently constraint the shape of the distributions. Figure: Redshift distributions for the six tomographic bins of MagLim as estimated in the Buzzard simulations, before and after incorporating the clustering information. Estimated using a 12×12 cell deep SOM and 32×32 cell wide SOM trained on Buzzard simulations. The solid line marks the true value, while the outlined violins represent the n(z) ensemble from the photometric redshifts technique SOMPZ which incorporate sample variance and shot noise, and finally the solid violins are the realisations once combined with clustering redshifts. The tighter constraint on the shape of the distribution is particularly important for a lens sample, since the galaxy clustering and galaxy-galaxy lensing measurements are more sensitive to higher-order moments of the n(z) distributions rather than the mean.
Theory
Dark Energy Survey Year 3 Results: Multi-Probe Modeling Strategy and Validation
Authors: E. Krause (krausee@arizona.edu), X. Fang et al.
This paper details the modeling pipeline and validates the baseline analysis choices of the DES Year 3 joint analysis of galaxy clustering and weak lensing (a so-called 3x2pt analysis). These analysis choices include the specific combination of cosmological probes, priors on cosmological and systematics parameters, model parameterizations for systematic effects and related approximations, and angular scales where the model assumptions are validated. We run a large number of simulated likelihood analyses using synthetic data vectors to test the robustness of our baseline analysis. We demonstrate that the DES Year 3 modeling pipeline, including the calibrated scale cuts, is sufficiently accurate relative to the constraining power of the DES Year 3 analyses.
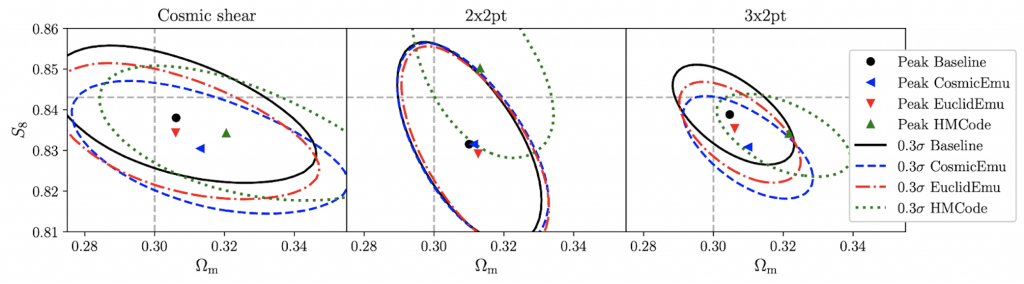
Figure: Impact of non-linear matter power spectrum modeling uncertainties on DES-Y3 parameter constraints
Dark Energy Survey Year 3 Results: Covariance Modelling and its Impact on Parameter Estimation and Quality of Fit
Authors: O. Friedrich (of259@ast.cam.ac.uk), F. Andrade-Oliveira, H. Camacho, O. Alves, R. Rosenfeld, J. Sanchez, X. Fang, T. F. Eifler, E. Krause, C. Chang, Y. Omori, A. Amon, E. Baxter, J. Elvin-Poole, D. Huterer, A. Porredon, J. Prat, V. Terra, A. Troja et al.
Link to paper(arXiv) Link to paper(MNRAS)
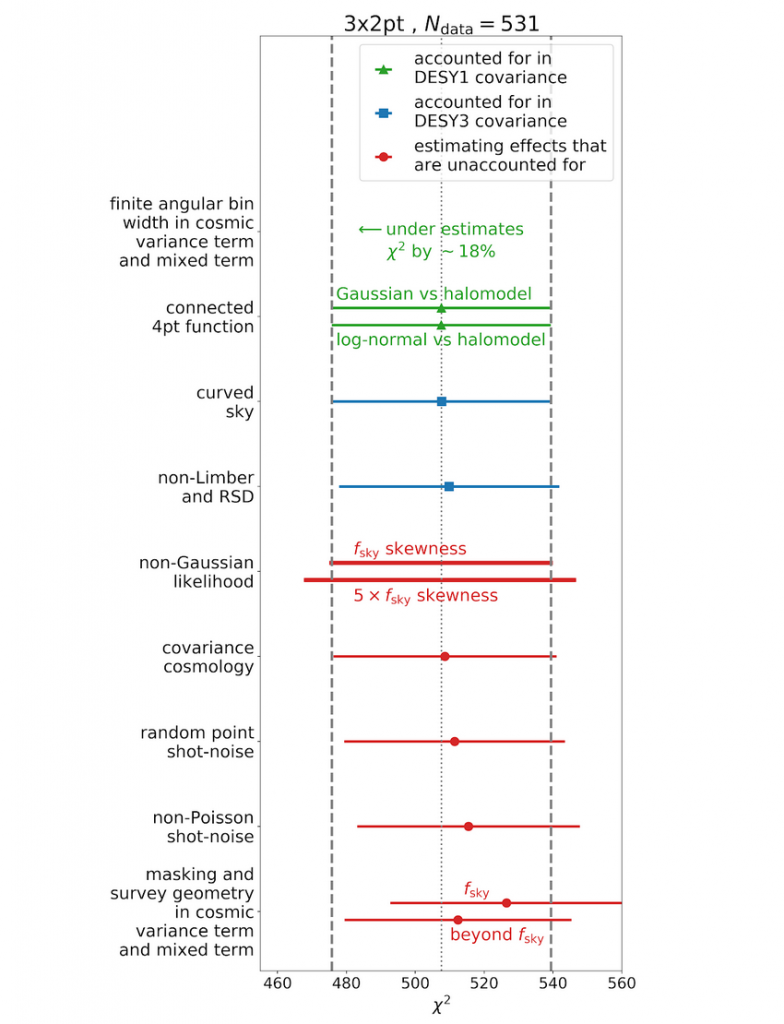
We describe and test the fiducial covariance matrix model for the combined 2-point function analysis of the Dark Energy Survey Year 3 dataset. Using a variety of new ansatzes for covariance modelling and testing we validate the assumptions and approximations of this model. These include the assumption of Gaussian likelihood, the trispectrum contribution to the covariance, the impact of evaluating the model at a wrong set of parameters, the impact of masking and survey geometry, deviations from Poissonian shot-noise, galaxy weighting schemes and other, sub-dominant effects. We find that our covariance model is robust and that its approximations have little impact on goodness-of-fit and parameter estimation. The largest impact on best-fit figure-of-merit arises from the so-called f_sky approximation for dealing with finite survey area, which on average increases the χ2 between maximum posterior model and measurement by 3.7%.
Figure: Impact of different covariance modelling choices on χ2 between measured 3x2pt datavectors and maximum posterior models. The dashed vertical lines and error bars indicate the 1σ fluctuations expected in χ2.
Robust sampling for weak lensing and clustering analyses with the Dark Energy Survey
Authors: P. Lemos (p.lemos@susex.ac.uk), N. Weaverdyck (nweaverdyck@lbl.gov), R. P. Rollins, J. Muir, A. Ferté, A.R. Liddle, A. Campos, D. Huterer, M. Raveri, J. Zuntz, E. Di Valentino, X. Fang, W.G. Hartley et al.
Link to paper(arXiv) Link to paper(MNRAS)
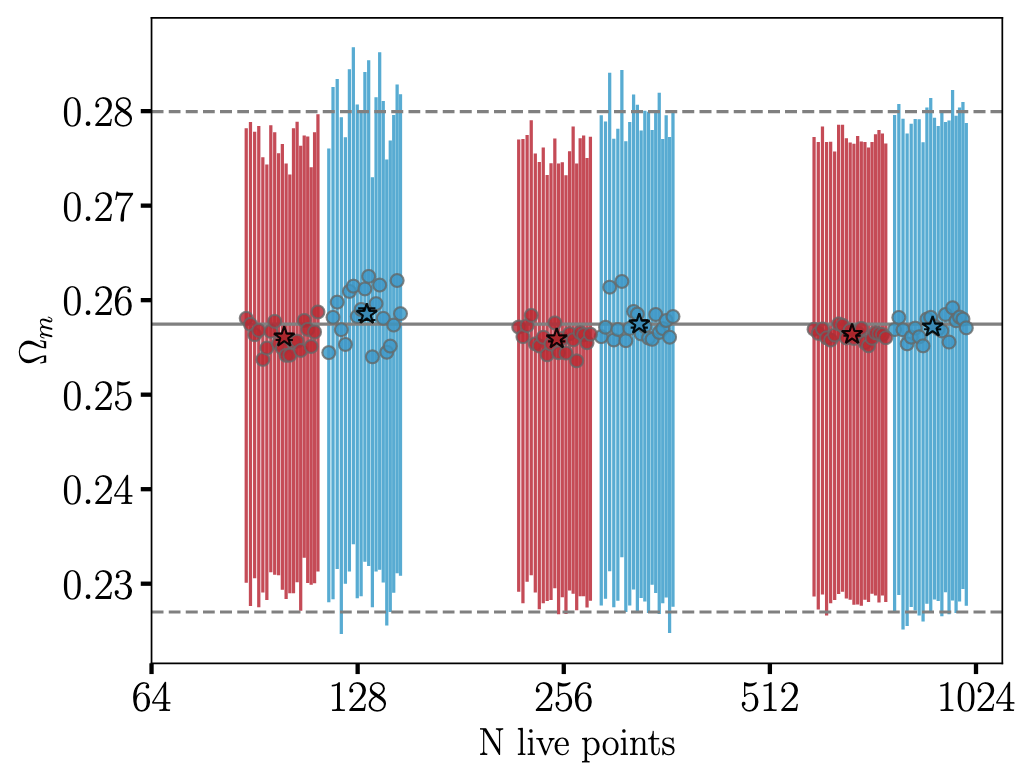
Recent cosmological analyses rely on the ability to accurately sample from high-dimensional posterior distributions. A variety of algorithms have been applied in the field, but justification of the particular sampler choice and settings is often lacking. Here we investigate three such samplers to motivate and validate the algorithm and settings used for the Dark Energy Survey analyses of the first 3 years (Y3) of data from combined measurements of weak lensing and galaxy clustering. We determine that the sampler 𝙿𝚘𝚕𝚢𝙲𝚑𝚘𝚛𝚍 provides a good balance of speed and robustness, and recommend different settings for testing purposes and final chains for analyses with DES Y3 data. Our methodology can readily be reproduced to obtain suitable sampler settings for future surveys.
Figure: 1D marginalized mean and 68% credible intervals for omega_m for both the 𝙼𝚞𝚕𝚝𝚒𝙽𝚎𝚜𝚝 (red) and 𝙿𝚘𝚕𝚢𝙲𝚑𝚘𝚛𝚍 (blue) samplers on the DES y1 dataset.
Assessing tension metrics with Dark Energy Survey and Planck data
Authors: P. Lemos (pablo.lemos.18@ucl.ac.uk), M. Raveri, A. Campos, Y. Park, C. Chang, N. Weaverdyck, D. Huterer, A. R. Liddle, et al.
Link to paper(arXiv) Link to paper(MNRAS)
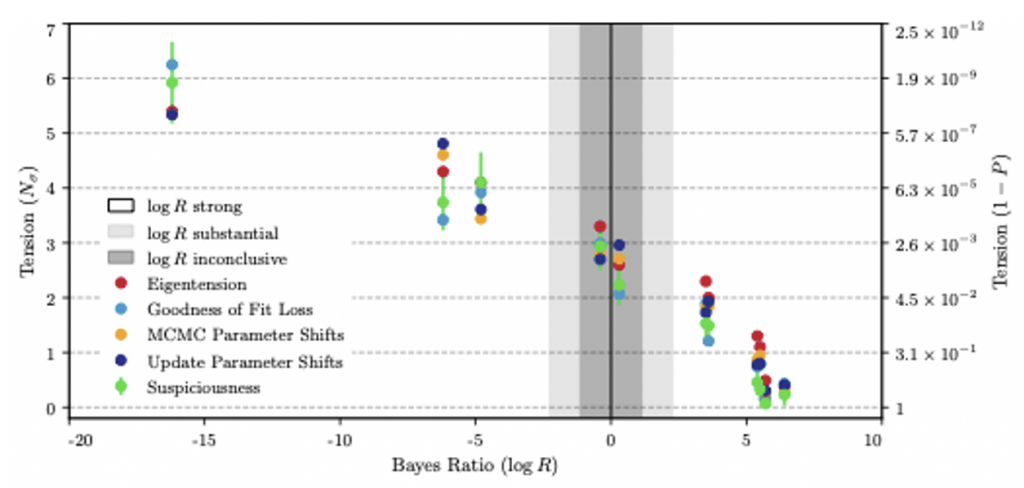
Quantifying tensions — inconsistencies amongst measurements of cosmological parameters by different experiments — has emerged as a crucial part of modern cosmological data analysis. Statistically-significant tensions between two experiments or cosmological probes may indicate new physics extending beyond the standard cosmological model and need to be promptly identified. We apply several tension estimators proposed in the literature to the DES large-scale structure measurement and Planck cosmic microwave background data. We find that the parameter differences, Eigentension, and Suspiciousness metrics all yield similar results on both simulated and real data, while the Bayes ratio is inconsistent with the rest due to its dependence on the prior volume. Using these metrics, we calculate that DES Year 1 and Planck have 2.3 sigma tension under the Lambda-CDM paradigm. This suite of metrics provides a toolset for robustly testing tensions in the DES Year 3 data and beyond.
Figure: Tension estimates given by different metrics versus the corresponding Bayes ratio. Shaded regions highlight Jeffreys’ scale used to interpret the Bayes ratio, with the vertical line separating “Tension” to the left and “Agreement” to the right.
Dark Energy Survey internal consistency tests of the joint cosmological probes analysis with posterior predictive distributions
Authors: C. Doux (cdoux@sas.upenn.edu), E. Baxter, P. Lemos, C. Chang, et al.
Link to paper (arXiv) Link to paper (MNRAS)
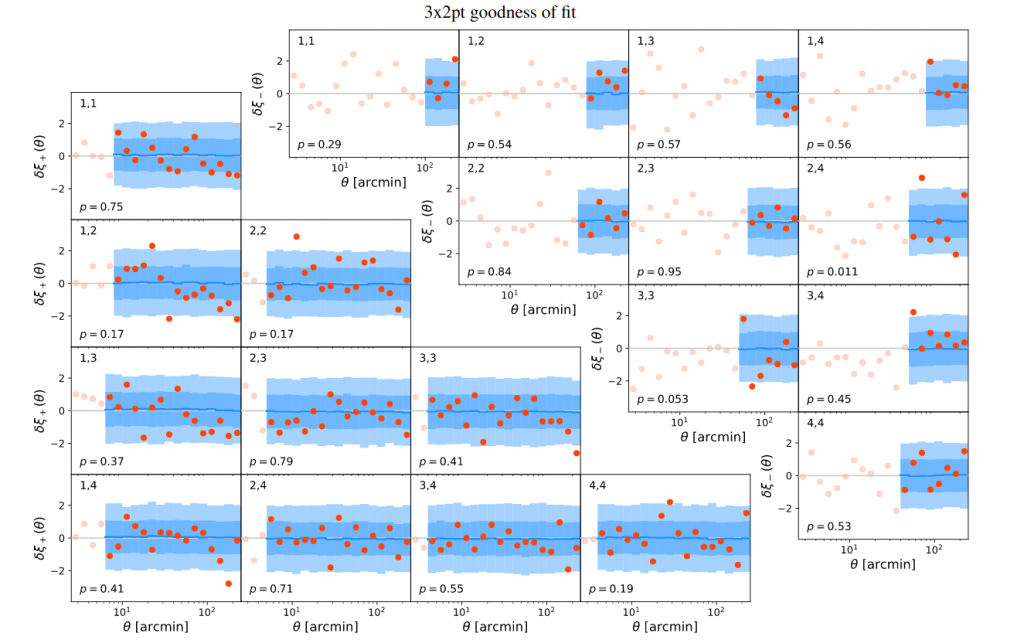
We present the methodology for testing the internal consistency of the Dark Energy Survey (DES) measurements of cosmic shear, galaxy-galaxy lensing and galaxy clustering. We focus on data space tests to best identify potential inconsistent subsets using posterior predictive distributions. When applied to DES Year 1 data, we find overall good consistency and a good fit to ΛCDM. We test consistency by splitting the data into different probes, redshift bins and scales and find a small tension between large- and small-scale measurements (at the <2σ level).
Figure: Excerpt from Fig 2 of paper, comparing the posterior predictive distribution in blue and data in red for cosmic shear measurements when testing for 3x2pt goodness-of-fit (for both, we subtracted the best-fit and divided by the error for visualization).
Blinding multi-probe cosmological experiments
Authors: J. Muir (jlmuir@stanford.edu), G. Bernstein, D. Huterer, F. Elsner, E. Krause, A. Roodman, et al.
Link to paper (arXiv) Link to paper (MNRAS)
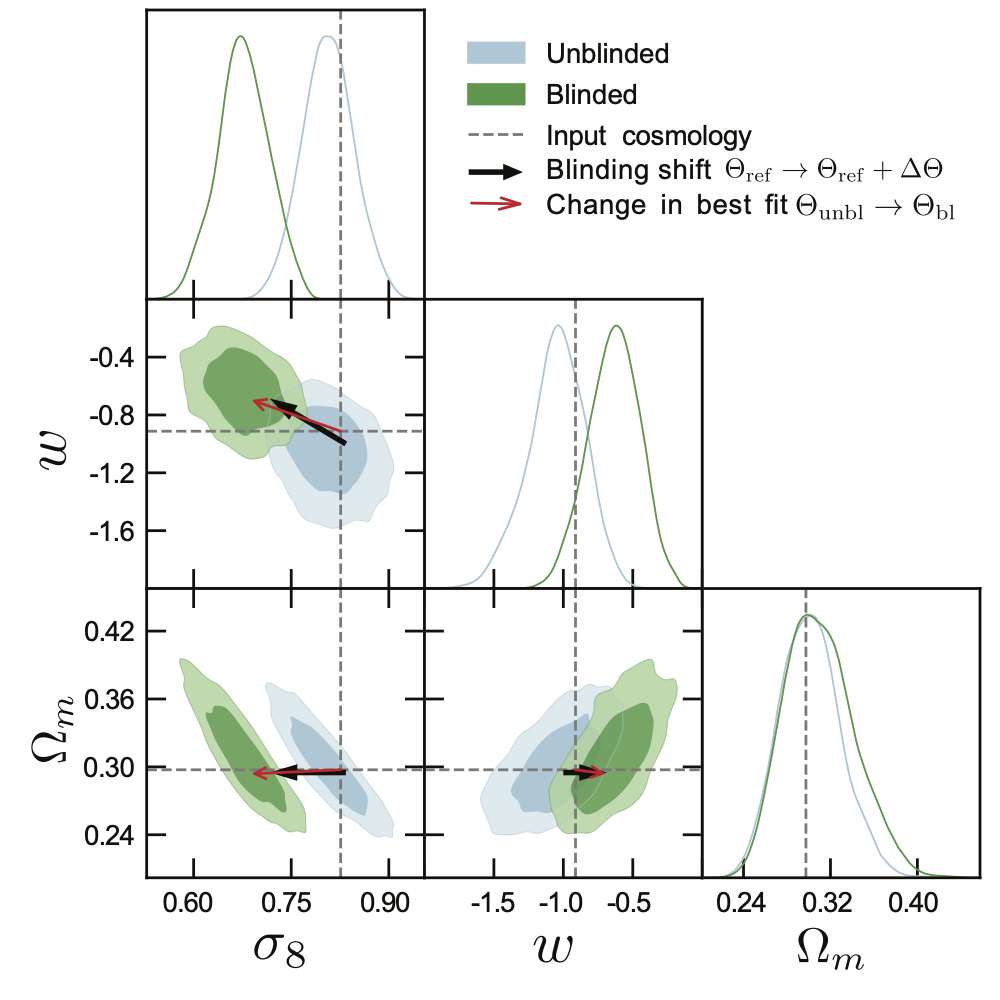
This paper introduces the transformation applied to DES Y3 galaxy clustering and weak lensing measurements in order to hide the cosmology results until decisions about how to conduct the analysis were finalized. The goal of this kind of concealment, known as blinding, is to protect the DES analysis from bias that might be unconsciously introduced if experimenters are looking at how analysis choices influence how the results compare to their expectations. DES is the first analysis to use this method, which works by altering the two-point correlation functions that are input to parameter estimation. This paper shows that, for simulated DES Y3 analyses, the transformation can successfully change the best-fit cosmological parameters while preserving the internal consistency of different parts of data.
Figure: Effect of the blinding transformation on a simulated DES Y3 analysis.
Dark Energy Survey Year 3 results: cosmology from combined galaxy clustering and lensing – validation on cosmological simulations
Authors: J. DeRose (jderose@lbl.gov), R. H. Wechsler, M. R. Becker, E. S. Rykoff, S. Pandey, N. MacCrann, A. Amon, J. Myles, E. Krause, D. Gruen, B. Jain, M. A. Troxel, J. Prat, A. Alarcon, C. Sanchez, J. Blazek, M. Crocce, G. Giannini, M. Gatti, G. M. Bernstein, J. Zuntz, S. Dodelson, X. Fang, O. Friedrich, L. F. Secco, J. Elvin-Poole, A. Porredon, S. Everett, A. Choi, I. Harrison, J. Cordero, M. Rodriguez-Monroy, J. McCullough et al.
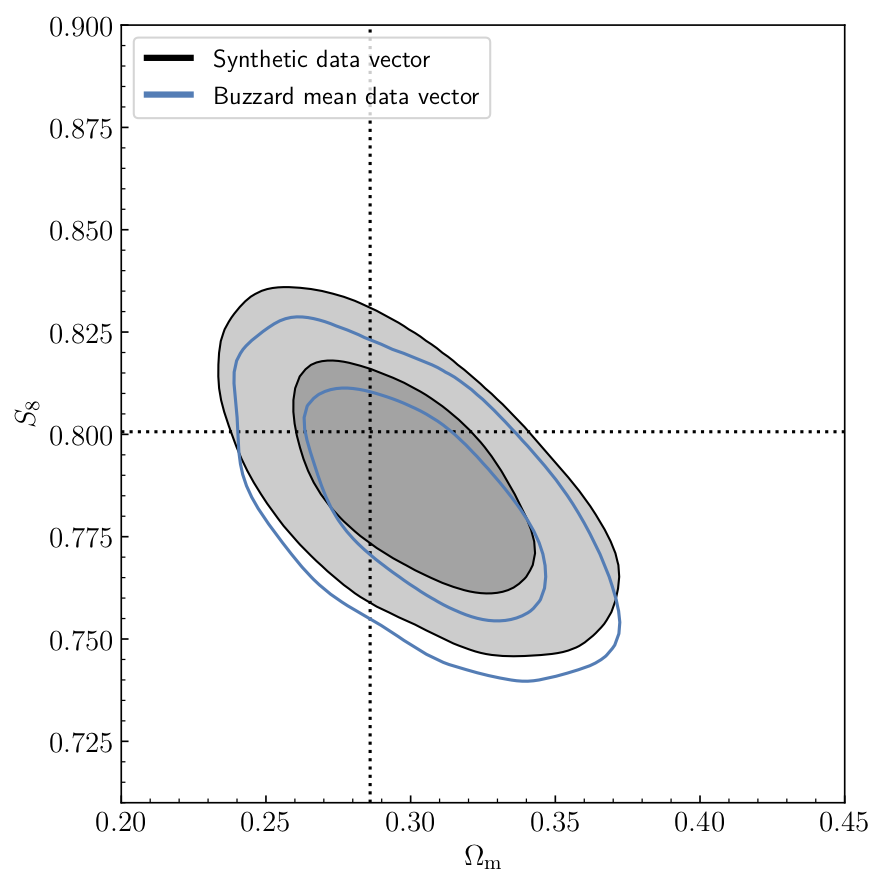
We present a validation of the DES Y3 3×2-point analysis choices by testing them on Buzzard v2.0, a new suite of cosmological simulations that are tailored for the testing and validation of combined galaxy clustering and weak lensing analyses. We show that the Buzzard v2.0 simulations accurately reproduce many important aspects of the DES Y3 data, including photometric redshift and magnitude distributions, and the relevant set of two-point clustering and weak lensing statistics. We demonstrate for the first time that our photometric redshift calibration methodology, including information from photometry, spectroscopy, clustering cross-correlations and galaxy-galaxy lensing ratios, is accurate enough to recover the true cosmology in simulated surveys in the presence of realistic photometric redshift uncertainties.
Figure: The validation of the DES Y3 3×2-point model and inference pipeline on the Buzzard simulation suite, where the true cosmology is indicated by the cross. An analysis of a synthetic data vector (black) at the true Buzzard cosmology based on the true redshift distributions with fixed shear and photo-z parameters is compared to a full analysis of the mean data vector of 18 simulation realizations (blue) including all nuisance parameters and n(z) distributions inferred in the same way we do using the real survey data. The negligible shift between the two contours demonstrates that our analysis is unbiased in a complex simulated analysis setting.
Dark Energy Survey Year 3 Results: Optimizing the Lens Sample in Combined Galaxy Clustering and Galaxy-Galaxy Lensing Analysis
Authors: A. Porredon (annam.porredon@gmail.com), M. Crocce, P. Fosalba, J. Elvin-Poole, I. Ferrero, E. Krause, X. Fang, T. Eifler, R. Cawthon, N. Weaverdyck, N. MacCrann, A. Carnero, et al.
Link to paper (arXiv) Link to paper (PRD)
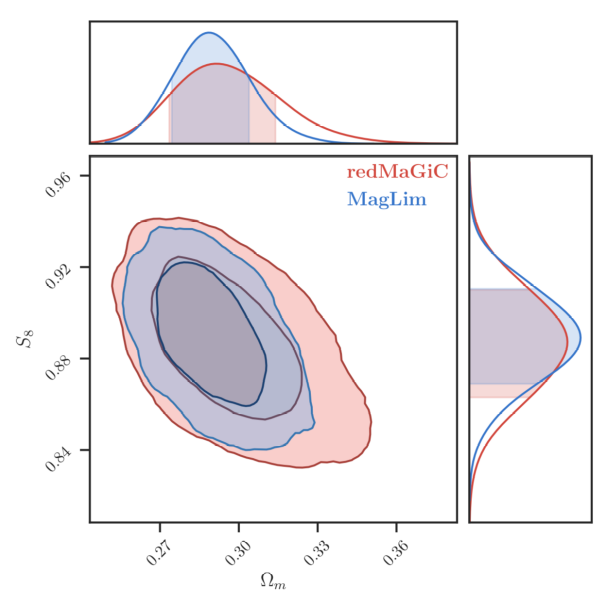
We investigate potential gains in cosmological constraints from the combination of galaxy clustering and galaxy-galaxy lensing by optimizing the lens galaxy sample selection, using information from DES Y3. We explore easily reproducible selections based on magnitude cuts in i-band as a function of (photometric) redshift, zphot, and look to balance number density vs. photometric accuracy. Our optimal selection, the MAGLIM sample, satisfies i < 4 zphot + 18 and has ∼ 3.5 times more galaxies than our reference sample, REDMAGIC. Assuming a wCDM model and equivalent scale cuts for nonlinear effects, it leads to gains of 16% in σ8, 10% in Ωm, and 12% in w. In ΛCDM we find an improvement of 19% and 27% on σ8 and Ωm, respectively.
Figure: ΛCDM constraints from the combination of galaxy clustering and galaxy-galaxy lensing using the REDMAGIC (red) and MAGLIM (blue) samples as lenses. The MAGLIM constraints are tighter by 27% on Ωm, and 11% on S8 compared to REDMAGIC.
Results
Dark Energy Survey Year 3 results: Magnification modeling and impact on cosmological constraints from galaxy clustering and galaxy-galaxy lensing
Authors: J. Elvin-Poole (jack.elvinpoole@gmail.com), N. MacCrann et al.
Link to paper (arXiv)
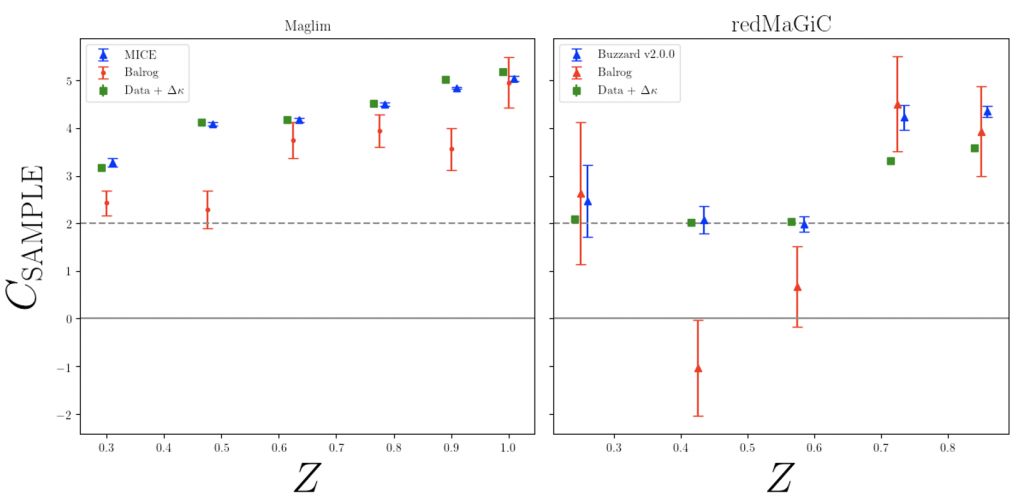
We present a study on the effect of magnification in the Dark Energy Survey year 3 analysis of galaxy clustering and galaxy-galaxy lensing on two different lens samples, redMaGiC, and MagLim. We account for the effect of magnification on both the flux and size selection of galaxies, accounting for systematic effects using the Balrog image simulations. We estimate the impact of magnification bias in the galaxy clustering and galaxy-galaxy lensing cosmology analysis, finding it to be a significant effect for the MagLim sample. We demonstrate the Y3 cosmological results are robust to magnification related analysis choices. Figure: Magnification coefficient estimates for the two lens samples. Each panel shows an estimate from an N-body simulation (blue triangles), image simulation (red circles) and from the data directly (green squares). The solid line corresponds to zero magnification bias from the sample itself. The dashed line corresponds to zero magnification signal in total.
Dark Energy Survey Year 3 results: Galaxy clustering and systematics treatment for lens galaxy samples
Authors: M. Rodríguez-Monroy (martin.rodriguez@ciemat.es), N. Weaverdyck, J. Elvin-Poole, M. Crocce, A. Carnero Rosell et al.
Link to paper(arXiv) Link to paper(MNRAS)
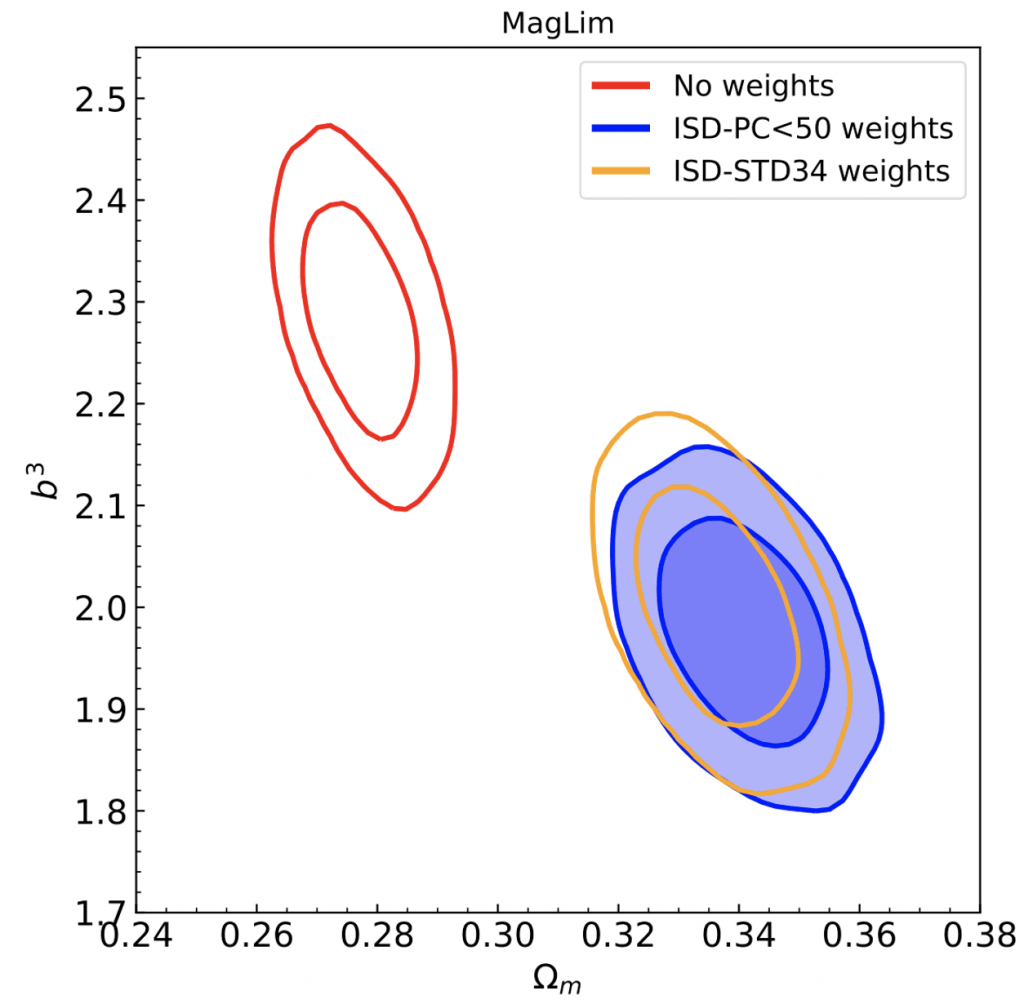
This paper presents the measurement of the two-point angular correlation function of DES Y3 lens galaxy samples: a magnitude-limited sample optimized for the measurement of cosmological parameters, MagLim, and sample of luminous red galaxies selected by the redMaGiC algorithm. We also introduce the methods that have been used to identify and mitigate the contamination in our data caused by spatially varying survey properties. We conduct a battery of validation tests with log-normal mocks to ensure the robustness of these corrections and to determine the systematic uncertainty that needs to be taken into account for the cosmology analysis.
Figure: Impact of the systematic contamination from survey properties on the estimation of cosmological parameters from the MagLim sample.
Dark Energy Survey Year 3 Results: High-precision measurement and modeling of galaxy-galaxy lensing
Authors: J. Prat (jprat@uchicago.edu), J. Blazek, C. Sánchez, I. Tutusaus, S. Pandey, J. Elvin-Poole, E. Krause, M. A. Troxel, L. F. Secco, A. Amon, J. DeRose, G. Zacharegkas, C. Chang, B. Jain, N. MacCrann, Y. Park, E. Sheldon, G. Giannini, S. Bocquet, C. To et al.
Link to paper(arXiv) Link to paper(PRD)
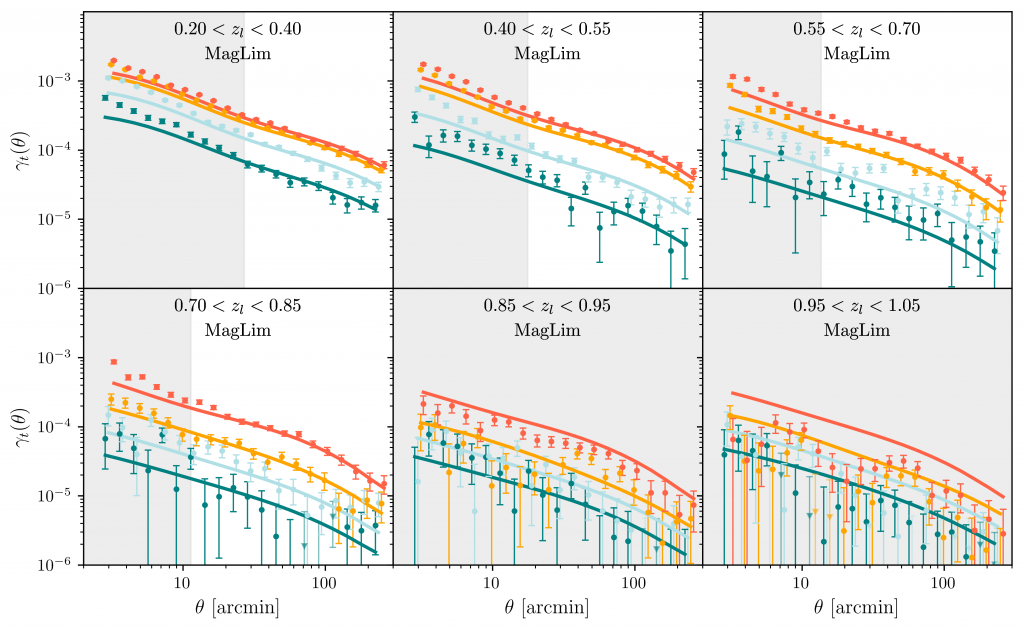
We present and characterize the galaxy-galaxy lensing signal measured using the first three years of data from the Dark Energy Survey (DES Y3) covering 4132 sq. deg. Our galaxy-galaxy lensing estimator is the mean tangential shear, for which we obtain a total S/N of ~148 for the MagLim (~120 for redMaGic) galaxy sample, and ~67 (~55) after applying the scale cuts of 6 Mpc/h. Thus we reach percent-level statistical precision, which requires that our modeling and systematic-error control be of comparable accuracy. The tangential shear model used in the 3x2pt cosmological analysis includes lens magnification, a five-parameter intrinsic alignment model (TATT), marginalization over a point-mass to remove information from small scales and a linear galaxy bias model validated with higher-order terms. We explore the impact of these choices on the tangential shear observable and study the significance of effects not included in our model, such as reduced shear, source magnification and source clustering. We also test the robustness of our measurements to various observational and systematics effects, such as the impact of observing conditions, lens-source clustering, random-point subtraction, scale-dependent Metacalibration responses, PSF residuals, and B-modes.
Figure: Tangential shear measurements of the MagLim sample together with the best-fit theory line from the DES Y3 3x2pt results. The shaded regions are excluded from the analysis.
Dark Energy Survey Year 3 results: curved-sky weak lensing mass map reconstruction
Authors: N. Jeffrey (niall.jeffrey@phys.ens.fr), M. Gatti (mgatti@ifae.es), C. Chang, L. Whiteway, U. Demirbozan, A. Kovacs, G. Pollina et al.
Link to paper(arXiv) Link to paper (MNRAS)
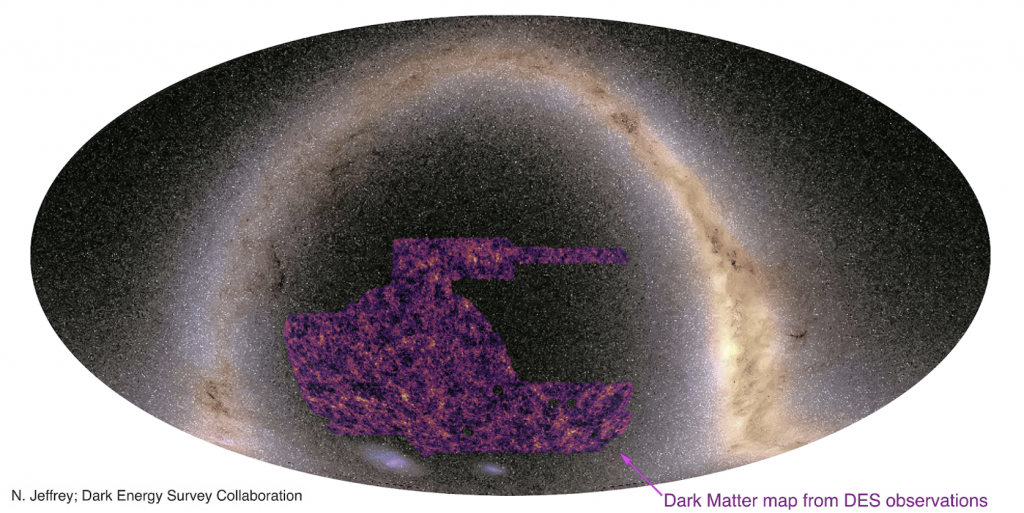
We present reconstructed convergence maps, mass maps, from the Dark Energy Survey (DES) third year (Y3) weak gravitational lensing data set. The mass maps are weighted projections of the density field (primarily dark matter) in the foreground of the observed galaxies. We quantify the performance of the methods at the map level and then apply the reconstruction methods to the DES Y3 data, performing tests for systematic error effects. The maps are compared with optical foreground cosmic-web structures and are used to evaluate the lensing signal from cosmic-void profiles. The recovered dark matter map covers the largest sky fraction of any galaxy weak lensing map to date.
Figure: Largest ever dark matter map from galaxy gravitational lensing using DES Y3 data. The reconstructed convergence map is shown overlaid upon the optical (Gaia) sky.
Dark Energy Survey Year 3 Results: Cosmology from Cosmic Shear and Robustness to Data Calibration
Authors: A. Amon (Amon2018@stanford.edu), D. Gruen, M. A. Troxel, N. MacCrann, S. Dodelson, A. Choi, C. Doux, L. F. Secco, S. Samuroff, E. Krause, J. Cordero, J. Myles, J. DeRose, R. Wechsler, M. Gatti, A. Navarro-Alsina, G. M. Bernstein, B. Jain, J. Blazek, A. Alarcon, A. Ferté, P. Lemos, M. Raveri, A. Campos, J. Prat, C. Sánchez, M. Jarvis et al.
Link to paper(arXiv) Link to paper(PRD)
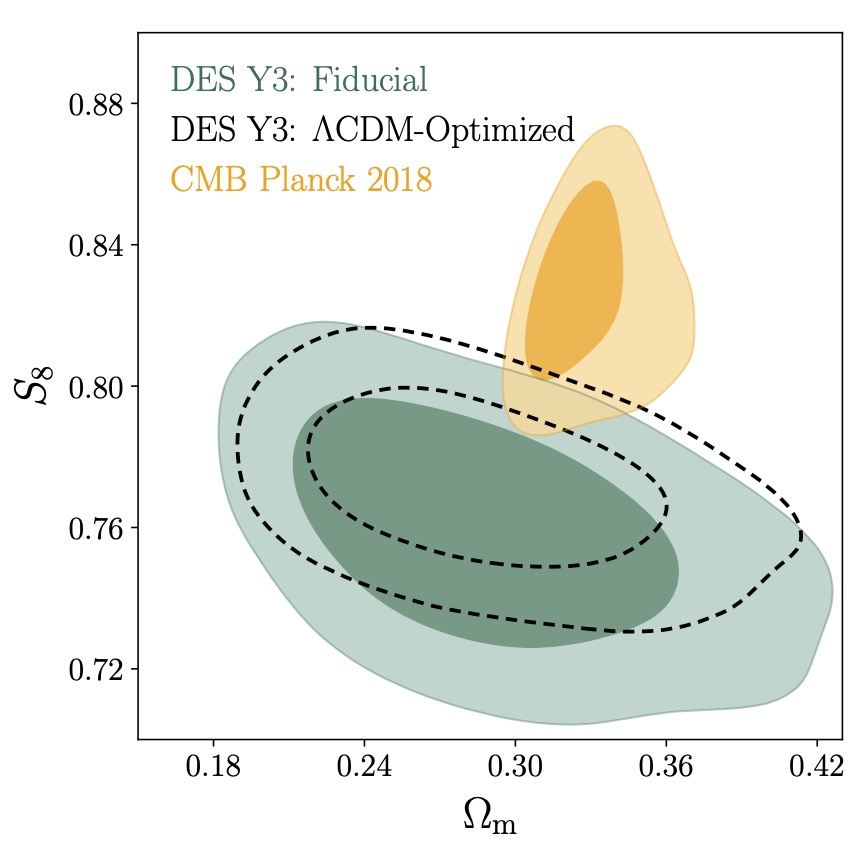
This work, together with its companion paper, Secco & Samuroff et al (2021), presents the DES Year 3 cosmic shear measurements and cosmological constraints based on an analysis of over 100 million source galaxies. With the data spanning 4143 deg^2 on the sky, we produce the highest significance measurement of cosmic shear to date. We conduct a blind analysis in the context of the LambdaCDM model and find a 3% constraint of the clustering amplitude, S_8 = 0.759 {+0.025}/{-0.023}. A LCDM-Optimized analysis, which safely includes smaller scale information, yields a 2% precision measurement of S_8= 0.772 {+0.018}/{-0.017}. The two low-redshift measurements are statistically consistent with Planck 2018, however, both recovered S_8 values are lower than the high-redshift prediction by ~2 sigma$. The measurements are shown to be internally consistent and the analysis is demonstrated to be robust to observational systematics, in particular, redshift estimation and blending. We examine the limiting factors for the precision of the cosmological constraints and find observational systematics to be subdominant to the modeling of astrophysics.
Figure: The DES Y3 cosmic shear cosmological constraints, derived from over 100 million galaxies and the highest-significance measurements to date, compared to the Planck 2018 CMB result.
Dark Energy Survey Year 3 Results: Cosmology from Cosmic Shear and Robustness to Modeling Uncertainty
Authors: L. F. Secco (secco@uchicago.edu), S. Samuroff (ssamuroff@cmu.edu), E. Krause, B. Jain, J. Blazek, M. Raveri, A. Campos, A. Amon, A. Chen, C. Doux, A. Choi, D. Gruen, G. M. Bernstein, C. Chang, J. DeRose, J. Myles, A. Ferte, P. Lemos, D. Huterer, J. Prat, M. A. Troxel, N. MacCrann, A. R. Liddle, T. Kacprzak, X. Fang, C. Sanchez, S. Pandey, S. Dodelson, P. Chintalapati, K. Hoffmann et al.
Link to paper(arXiv) Link to paper(PRD)
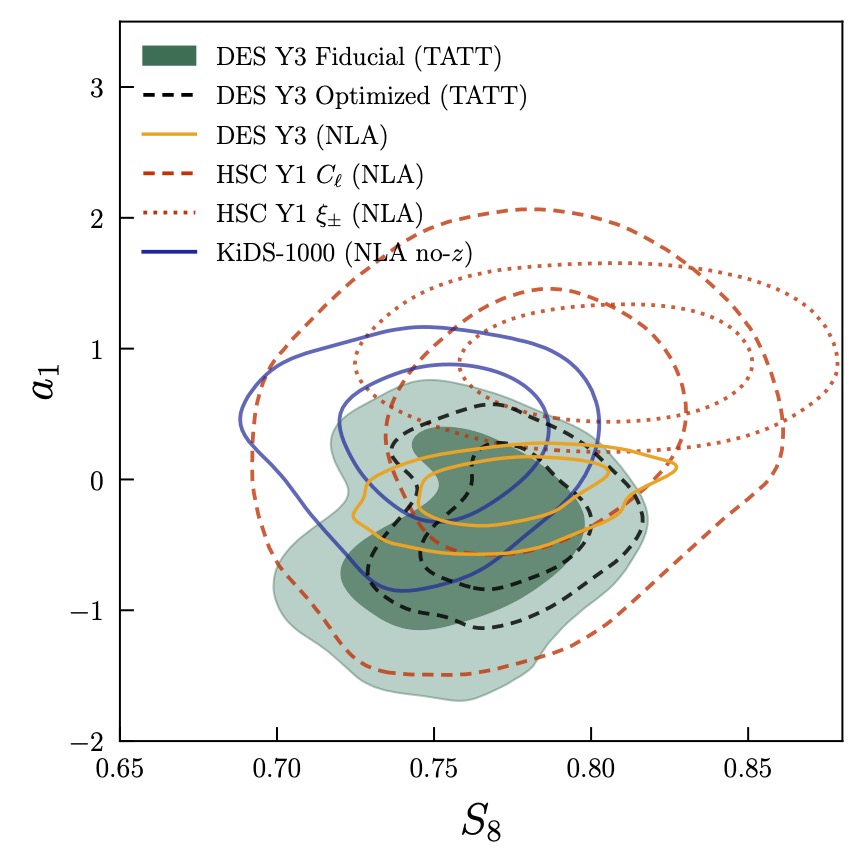
This work and its companion paper, Amon et al (2021), present cosmic shear measurements and cosmological constraints from over 100 million source galaxies in the Dark Energy Survey Year 3 data. This paper focuses on the robustness of these cosmic shear results to modeling of intrinsic alignments, the matter power spectrum and baryonic physics. We additionally explore the statistical preference of our data for intrinsic alignment models of different complexity. In a blind analysis, we constrain the lensing amplitude parameter S8 at the 3% level in LCDM (S8=0.759±0.024), and at the 2% level with optimized scale cuts (S8=0.772±0.017). We find a 2.3σ difference between our S8 result and that of Planck (2018), indicating no statistically significant tension, and additionally find our results to be in qualitative agreement with current weak lensing surveys (KiDS-1000 and HSC).
Figure: DES Y3 cosmic shear constraints on the lensing amplitude S8 and on the intrinsic alignment parameter a1, compared to other current weak lensing surveys. Despite the many differences in analysis and modeling choices, we find these surveys to be in qualitative agreement on these parameters of great importance for astrophysics and cosmology.
Dark Energy Survey Year 3 Results: Constraints on cosmological parameters and galaxy bias models from galaxy clustering and galaxy-galaxy lensing using the redMaGiC sample
Authors: S. Pandey (shivamp@sas.upenn.edu), E. Krause, J. DeRose, N. MacCrann, B. Jain, M. Crocce, J. Blazek, A. Choi, H. Huang, C. To, X. Fang, J. Elvin-Poole, J. Prat, A. Porredon, L. F. Secco, M. Rodriguez-Monroy, N. Weaverdyck, Y. Park, M. Raveri, E. Rozo, E. S. Rykoff, G. M. Bernstein, C. Sánchez, M. Jarvis, M. A. Troxel, G. Zacharegkas, C. Chang et al.
Link to paper(arXiv) Link to paper(PRD)
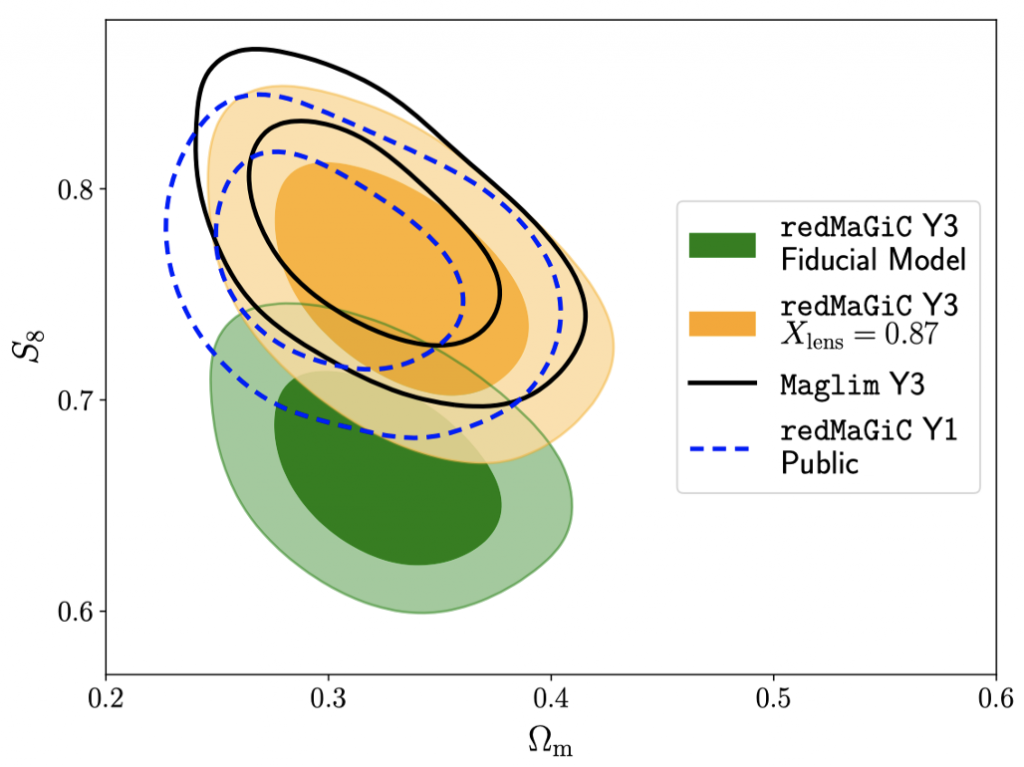
We constrain cosmological parameters and galaxy-bias parameters using the combination of galaxy clustering and galaxy-galaxy lensing measurements from the Dark Energy Survey Year-3 data. We describe our modeling framework, implementing linear and non-linear galaxy bias models, choices of scales analyzed, and validate their robustness to theoretical uncertainties. Using the linear galaxy bias model and redMaGiC galaxy sample, we obtain 10% constraints on the matter density of the universe, consistent with previous studies. When analyzing smaller scales with the nonlinear galaxy bias model, we find an approximately 20% gain in the cosmological constraints. Using the redMaGiC galaxy sample as foreground lens galaxies, we find the galaxy clustering and galaxy-galaxy lensing measurements to exhibit significant signals akin to decorrelation between galaxies and mass on large scales, which is not expected in any current models. This likely systematic measurement error biases our constraints on galaxy bias and the clustering amplitude parameter. We find that a scale-, redshift- and sky-area-independent phenomenological decorrelation parameter can effectively capture this inconsistency between the galaxy clustering and galaxy-galaxy lensing. After accounting for this decorrelation, we infer the constraints on the mean host halo mass of the redMaGiC galaxies from the large-scale bias constraints, finding the galaxies occupy halos of mass approximately 2 x 10^13 solar-masses.
Figure: Comparison of the constraints from this analysis using redMaGiC, with and without using the bestfit value of de-correlation parameter in the orange and green contours respectively. We find a shift in the lensing amplitude parameter between the two contours, but matter density constraints are fully consistent.
Dark Energy Survey Year 3 results: Cosmological constraints from galaxy clustering and galaxy-galaxy lensing using the MagLim lens sample
Authors: A. Porredon (annam.porredon@gmail.com), M. Crocce, J. Elvin-Poole, R. Cawthon, G. Giannini, J. De Vicente, A. Carnero Rosell, I. Ferrero, E. Krause, X. Fang, J. Prat, M. Rodriguez-Monroy, S. Pandey, A. Pocino, F. J. Castander, A. Choi, A. Amon, I. Tutusaus, S. Dodelson, I. Sevilla-Noarbe, P. Fosalba, E. Gaztanaga et al.
Link to paper Link to paper(PRD)
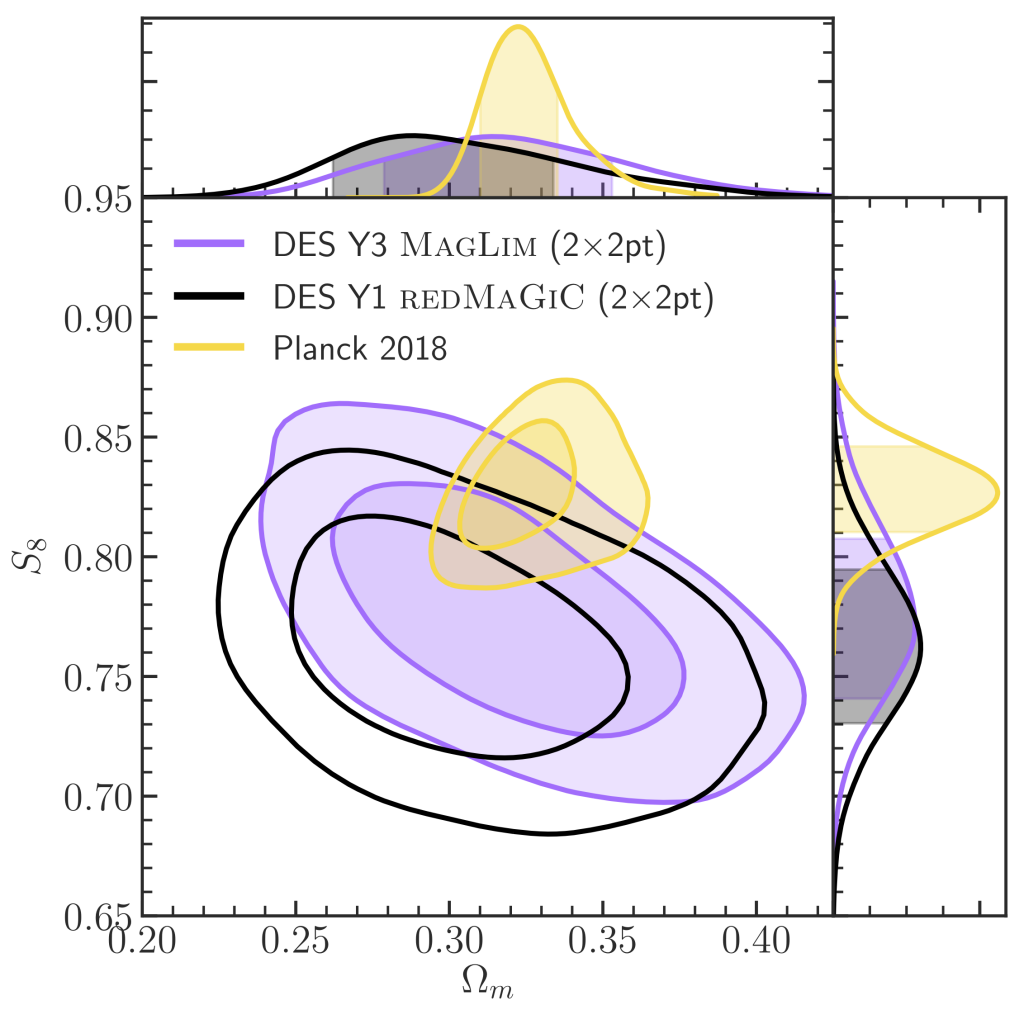
We present cosmological results from the full 5000 sq. deg. of the Dark Energy Survey first three years of observations (Y3) combining galaxy clustering and galaxy-galaxy lensing, using for the first time a magnitude-limited lens sample (MagLim) of 11 million galaxies especially selected to optimize such combination, and 100 million background shapes. In ΛCDM we obtain a value for the clustering amplitude S8 that is 1 sigma smaller than the prediction from measurements of the cosmic microwave background by the Planck satellite. We find that including smaller scales while marginalizing over nonlinear galaxy bias improves the constraining power by ~30%-40% while yielding consistent cosmological parameters from those in the linear bias case. Lastly, our results are consistent with those from DES Y1 data.
Figure: Constraints on S8 and omega_m in ΛCDM from galaxy-galaxy lensing and galaxy clustering using the MagLim sample. Also shown are the DES Y1 results and constraints from the Planck cosmic microwave background primary anisotropies.
Dark Energy Survey Year 3 results: Cosmological Constraints from Galaxy Clustering and Weak Lensing
Authors: Dark Energy Survey Collaboration et al.
Link to paper(arXiv) Link to paper(PRD)
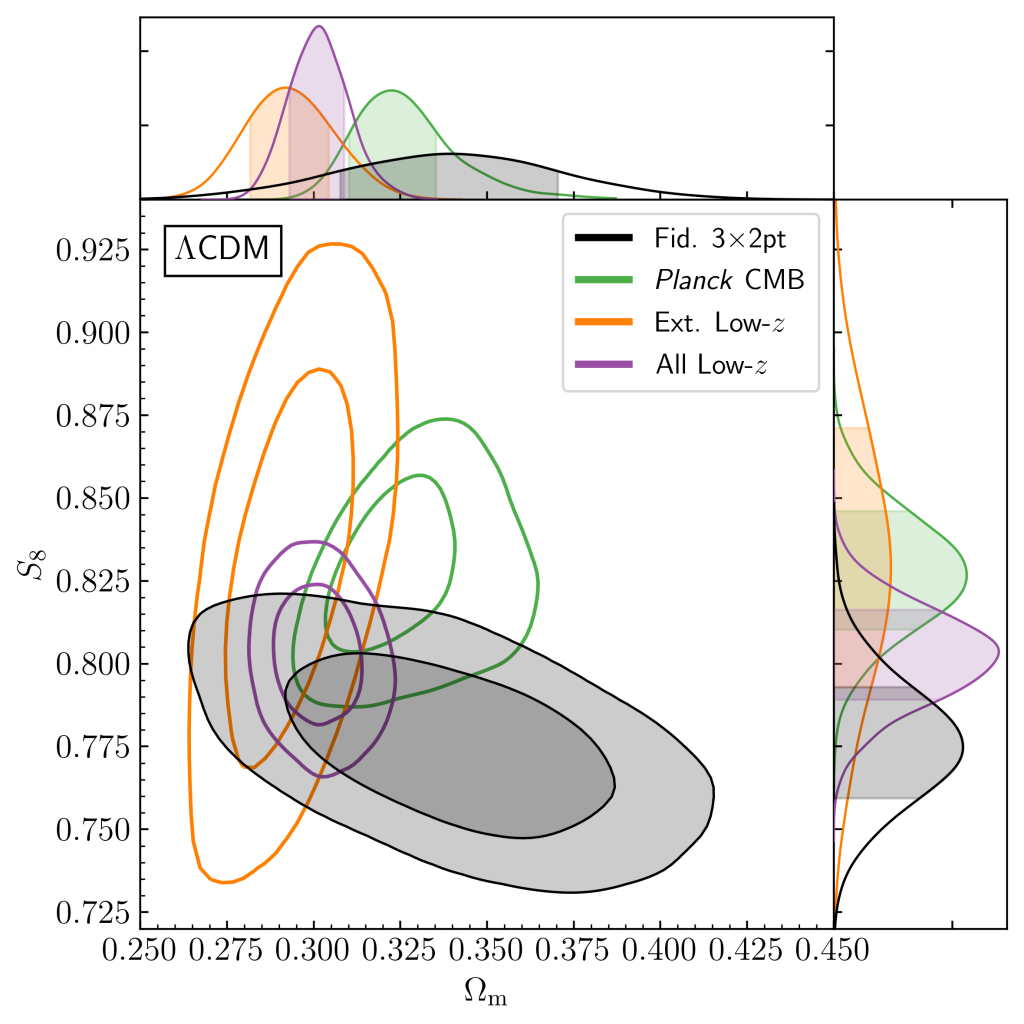
We present the first cosmology results from large-scale structure using the full 5000 sq. deg. of imaging data from the Dark Energy Survey (DES) Data Release 1. We perform an analysis of large-scale structure combining three two-point correlation functions (3x2pt): (i) cosmic shear using 100 million source galaxies, (ii) galaxy clustering, and (iii) the cross-correlation of source galaxy shear with lens galaxy positions, galaxy–galaxy lensing. To achieve the cosmological precision enabled by these measurements has required updates to nearly every part of the analysis from DES Year 1, including the use of two independent galaxy clustering samples, modeling advances, and several novel improvements in the calibration of gravitational shear and photometric redshift inference. The analysis was performed under strict conditions to mitigate confirmation or observer bias; we describe specific changes made to the lens galaxy sample following unblinding of the results and tests of the robustness of our results to this decision. We model the data within the flat LambdaCDM and wCDM cosmological models, marginalizing over 25 nuisance parameters. We find consistent cosmological results between the three two-point correlation functions; their combination yields clustering amplitude S_8=0.776 {+0.017}/{-0.017} and matter density Omega_m = 0.339 {+0.032}/{-0.031}$ in LambdaCDM, mean with 68% confidence limits; S_8=0.775 {+0.026}/{-0.024}, Omega_m = 0.352 {+0.035}/{-0.041}, and dark energy equation-of-state parameter w=-0.98 {+0.32}/{-0.20} in wCDM. These constraints correspond to an improvement in signal-to-noise of the DES Year 3 3x2pt data relative to DES Year 1 by a factor of 2.1, about 20% more than expected from the increase in observing area alone. This combination of DES data is consistent with the prediction of the model favored by the Planck 2018 cosmic microwave background (CMB) primary anisotropy data, which is quantified with a probability-to-exceed p=0.13 to 0.48. We find better agreement between DES 3x2pt and Planck than in DES Y1, despite the significantly improved precision of both. When combining DES 3x2pt data with available baryon acoustic oscillation, redshift-space distortion, and type Ia supernovae data, we find p=0.34. Combining all of these data sets with Planck CMB lensing yields joint parameter constraints of S_8 = 0.812 {+0.008}/{-0.008}, Omega_m = 0.306 {+0.004}/{-0.005}, h=0.680 {+0.004}/{-0.003}, and Sum m_nu<0.13 eV (95% CL) in LambdaCDM; S_8 = 0.812 {+0.008}/{-0.008}, Omega_m = 0.302 {+0.006}/{-0.006}, h=0.687 {+0.006}/{-0.007}, and w=-1.031 {+0.030}/{-0.027} in wCDM.
Figure: A comparison of constraints on the clustering amplitude S_8 and total matter density Omega_m in LambdaCDM from the fiducial DES Year 3 3x2pt data, the Planck cosmic microwave background (CMB) primary anisotropies, external low-redshift data (type Ia supernovae, baryon acoustic oscillations, and redshift space distortions), and all three combined.
Dark Energy Survey Year 3 Results: Constraints on extensions to ΛCDM with weak lensing and
galaxy clustering
Authors: Dark Energy Survey Collaboration et al.
Link to paper(arXiv) Link to paper(PRD)
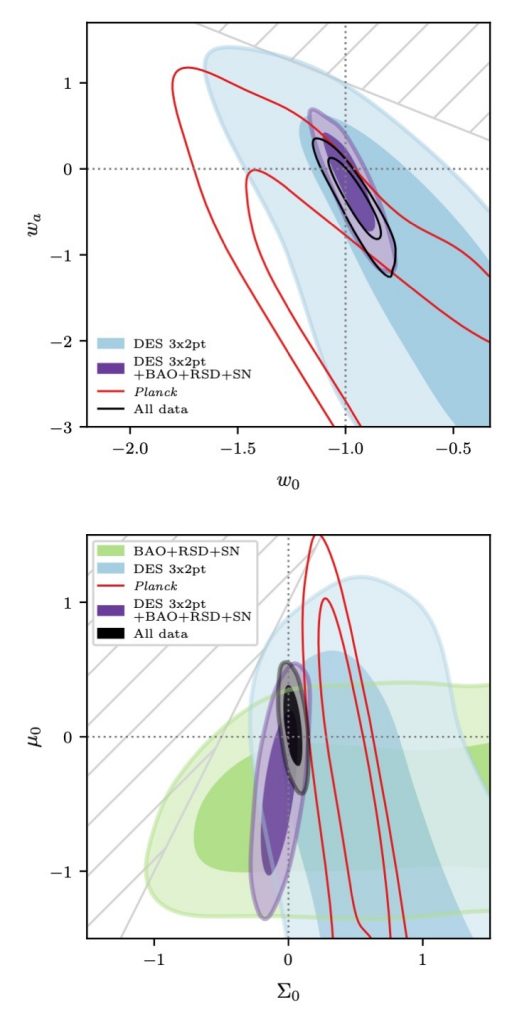
We constrain six extensions to the ΛCDM model using measurements from the Dark Energy Survey Year 3 weak lensing and clustering data, alone and in combination with external cosmological probes. The ΛCDM extensions are: dark energy with a time-dependent equation of state, non-zero spatial curvature, additional relativistic degrees of freedom, sterile neutrinos with eV-scale mass, modifications of gravitational physics, and a binned σ8(z) model which serves as a phenomenological probe of structure growth. We use simulated data vectors and blind analyses of real data to validate the robustness of our results to astrophysical and modeling systematic errors. In many cases, constraining power is limited by the absence of theoretical predictions beyond the linear regime that are reliable at our required precision. We find no preference for extended models compared to ΛCDM.
Figure: Constraints on beyond-LCDM parameters using DES Y3 galaxy clustering and weak lensing, compared to and in combination with external data.