This Darchive is a reposting of this article from KIPAC research highlights: https://kipac.stanford.edu/highlights/objects-mirror-are-bluer-they-appear-what-galaxys-color-says-about-its-distance
This article is based on the work in https://arxiv.org/abs/2012.08566 among other papers.
Understanding how the Universe evolved from a dense ball of superheated plasma to the vast canvas of stars and galaxies it is today—and what it will become next—remains a fundamental question asked throughout history. Today, we can begin to answer this question by making more precise measurements of objects in space, from our nearest neighbors to the deepest recesses of the visible Universe, than we’ve ever been able to before.
The resulting maps help us frame the question of how the Universe unfolds by measuring how cosmic structure—the web of galaxies that make up the Universe—grows over time, according to the rules of physics. A key part of measuring this cosmic structure is to determine the distances to the many galaxies we observe with our telescopes.
But distances turn out to be harder to measure than you might think.
In order to build the best possible description of cosmic structure, we have to take pictures of as many galaxies as possible. Unfortunately, simply taking pictures of a galaxy tells you very little about how far away that galaxy is. How can you figure out the distance to an object with only a simple photograph of it? (Remember, you don’t know its intrinsic size or brightness!) We rely on two tricks to achieve this.
First, the Universe is expanding, so distant galaxies are all moving away from us, and the farther away the galaxy, the faster it is receding. Using this fact, we can infer distance indirectly from the speed of the galaxy, so now we just have to figure out that speed.
This is where our second trick comes in: objects moving away from us appear redder than they really are because their motion effectively stretches the waves of light they emit, similarly to how the pitch of an ambulance siren varies as it approaches and recedes from an observer (i.e., the Doppler shift). With this second trick in hand, we can determine the speeds of galaxies as they race away from us by measuring how much redder they appear to us than their true color.
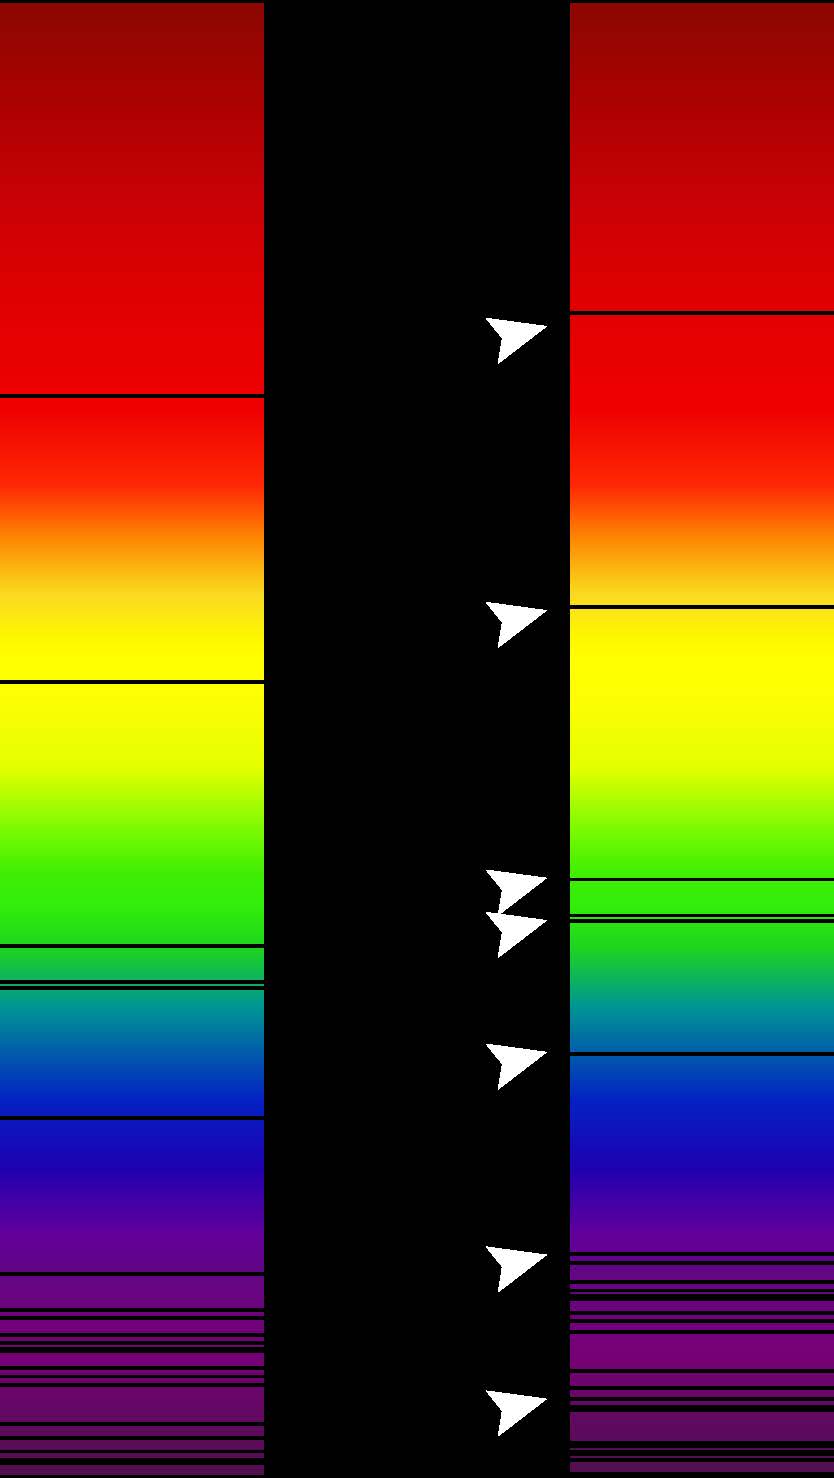
Figure 1: Absorption lines in the visible spectrum of a supercluster of distant galaxies (right), as compared to absorption lines in the visible spectrum of the Sun (left). Arrows indicate redshifted lines, compared to the ones on the left. Wavelength increases towards the red direction. (Image used under Creative Commons license CC BY-SA 3.0.)
Not surprisingly, the term for the reddening of a galaxy due to its recession is “redshift.” The most exact way of measuring this involves passing light from a galaxy through a complicated prism to find its spectrum, a unique color map where the arrangement of bright and dark lines is due to the presence of specific atoms, like oxygen or hydrogen, in the atmospheres of the galaxy’s stars. We know (from quantum mechanics) what colors of light these atoms should emit, so we can work out the distance by seeing how much redder they appear in our observations. But to resolve the exact colors in this way requires a large amount of telescope time per galaxy (in fact, when Hubble and others did this in the 1930’s, it took several nights per galaxy!). We can’t extract the exact redshift this way for our sample of 100 million galaxies because it would simply take too much time.
We overcome this problem by taking a picture of each galaxy more than once, each time covering the camera with one of several filters which only let light of a certain range of colors through. By taking images with these different filters, we can get some information about how bright the galaxy is in different colors. The resulting redshifts we measure with images from these filters are called “photometric redshifts” because they only rely on photometry, which refers to measuring how much light a galaxy emits in the different filter bands.
Scientists have worked on modeling the relationship between color and redshift with many advanced statistical and machine learning techniques such, as building libraries of templates that describe exactly how much light galaxies emit as a precise function of color, or training artificial neural networks to learn the relationship between color and redshift. These methods, as well-designed as they may be, are always limited by the fundamental uncertainty of the relationship between redshift and color observed with photometric filters, and by the fact that each galaxy is different and we do not know exactly what their original, non-redshifted colors look like.
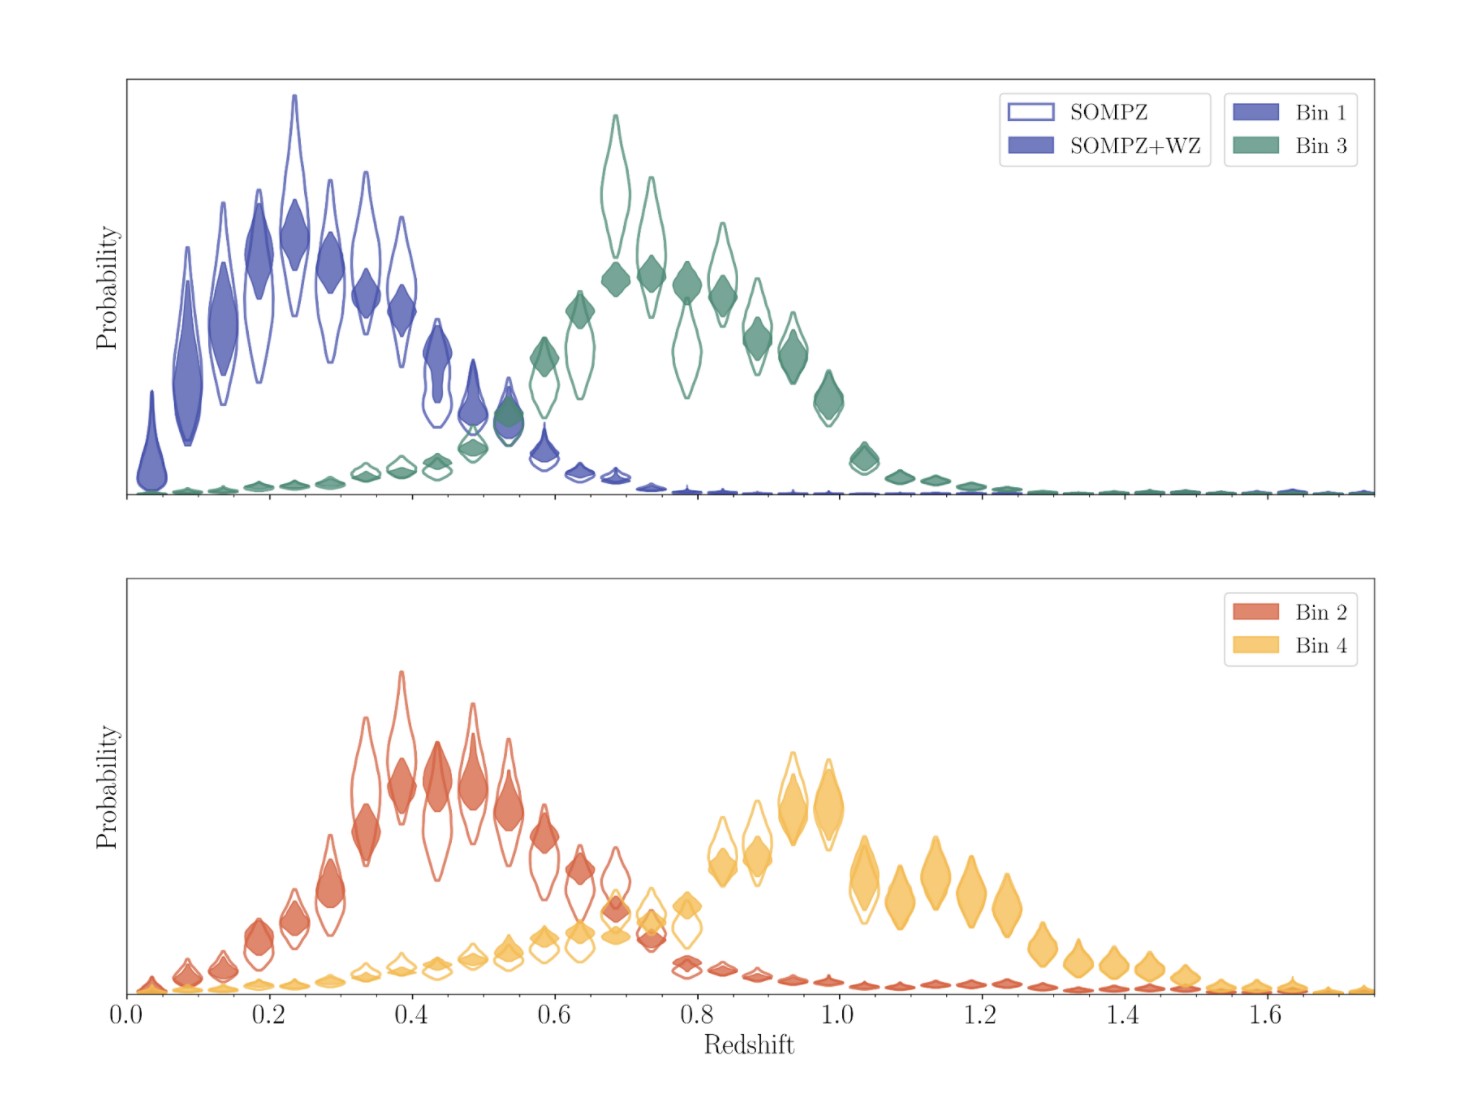
Figure 2: How many galaxies in our dataset are at a given redshift, separated into four galaxy bins. Each symbol represents how likely a galaxy from our sample is to be at a particular redshift. The symbol also represents our uncertainty on that likelihood: wider parts of the oval are more likely probabilities than narrower parts. (Credit: J. Myles, et al.)
In our latest work, we take advantage of a new way of combining color information from multiple telescope surveys of the sky using a type of artificial neural network called a self-organizing map. By combining colors from different telescopes, we reduce the uncertainty in our knowledge of the relationship between observed color and redshift. Our map is trained with a simple machine learning algorithm that groups galaxies of similar color into cells in the map. A key advancement of our work is to use two maps: one for galaxies where other telescopes have observed them in extra filters, and one for just our data. With these two maps, we are able to extract extra color information from other telescopes that observe colors of light that our camera can’t observe.
We used this algorithm to figure out distances to over 100 million galaxies observed with the Blanco Telescope at the Cerro-Tololo Inter-American Observatory as part of the Dark Energy Survey (DES). This new method improves our estimate of the average redshift of galaxies in our sample by approximately 50 percent, helping make the DES survey data the most powerful dataset of its kind!
Our distance measurements are a key piece of using this dataset to figure out how cosmic structure forms and what this implies about the nature of dark matter and dark energy. Our next goal is to do this even more precisely for the more than 10 billion galaxies to be observed with the Vera C. Rubin Observatory. This task stretches beyond our currently proven capabilities, motivating us to remain hard at work on further innovations in measurement methods. Stay tuned!
DArchive Author: Justin Myles
 Justin is a graduate student in the X-Ray Astronomy and Observational Cosmology group at Stanford University. He is interested in testing cosmological models with observations of galaxy cluster counts and weak gravitational lensing.