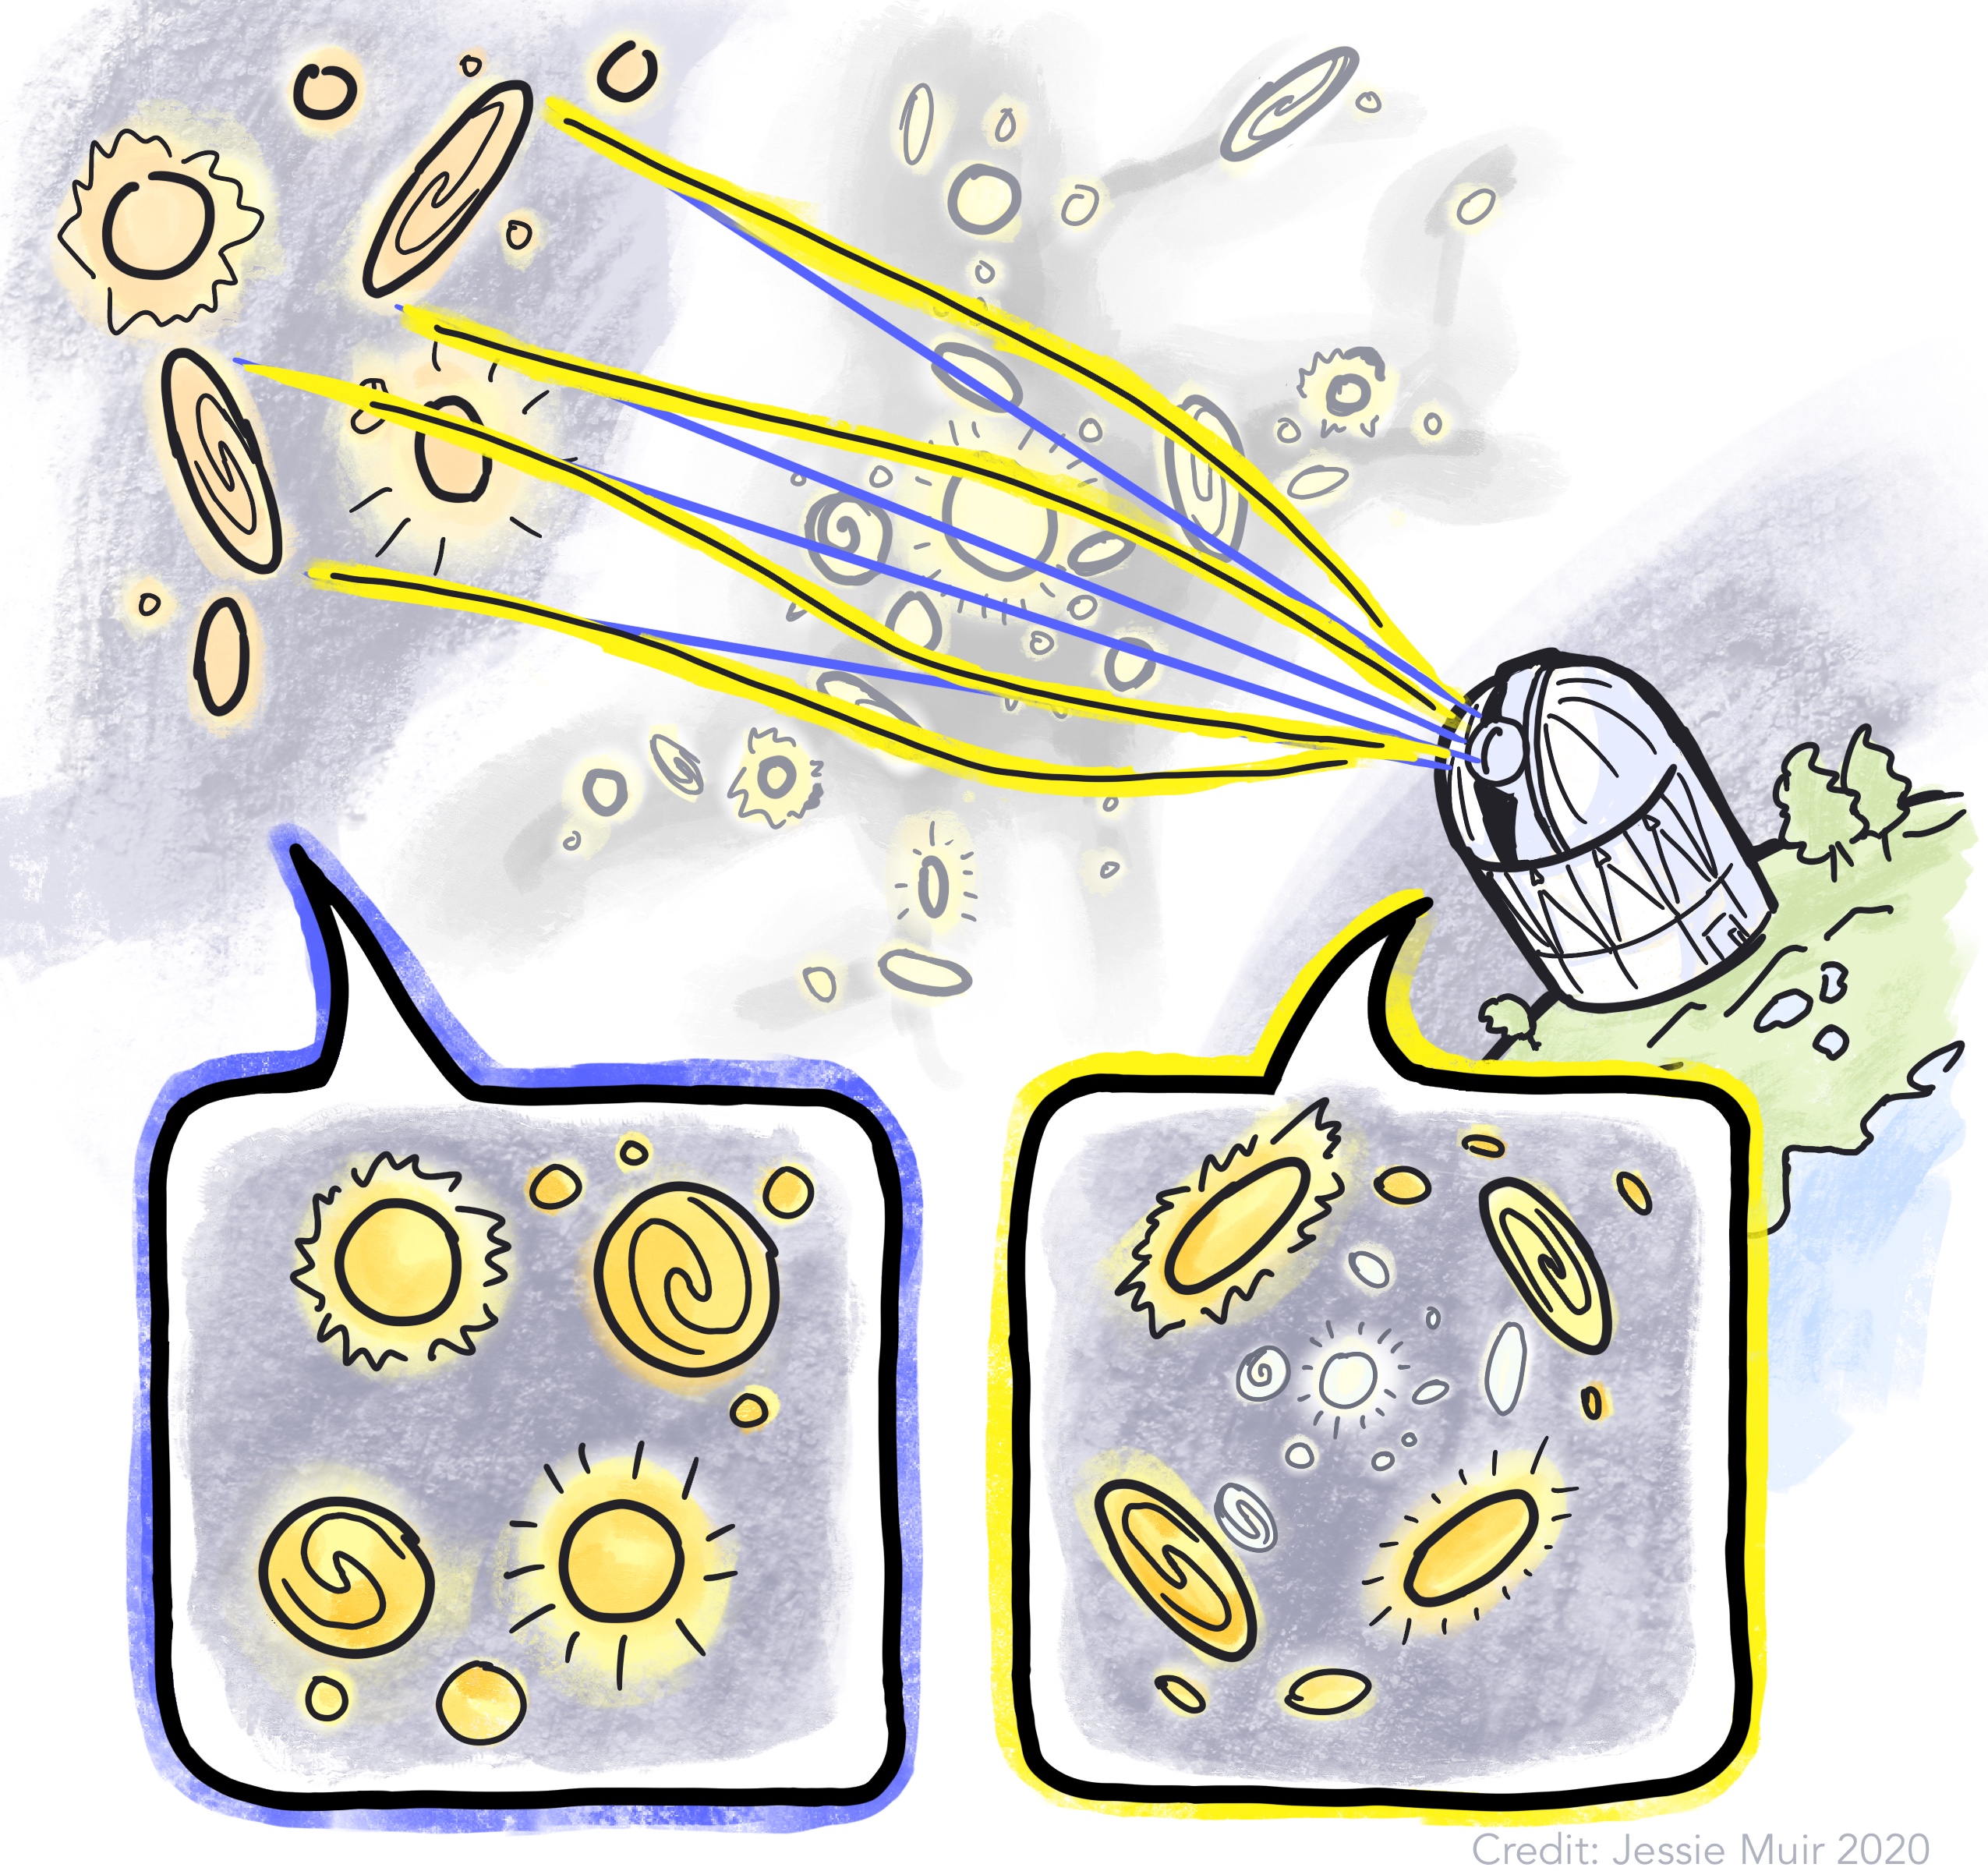
A cartoon showing the effect of gravitational lensing on the appearance of galaxies. Galaxies appear curved around the central ‘lens’ galaxies, which are closer to Earth. Image credit: Jessie Muir.)
This Darchive is a reposting of this article from KIPAC research highlights: https://kipac.stanford.edu/highlights/how-tease-out-tiniest-distortions-galaxy-shapes-probe-secrets-universe
This article is based on the work in https://arxiv.org/abs/2012.08567 among other papers.
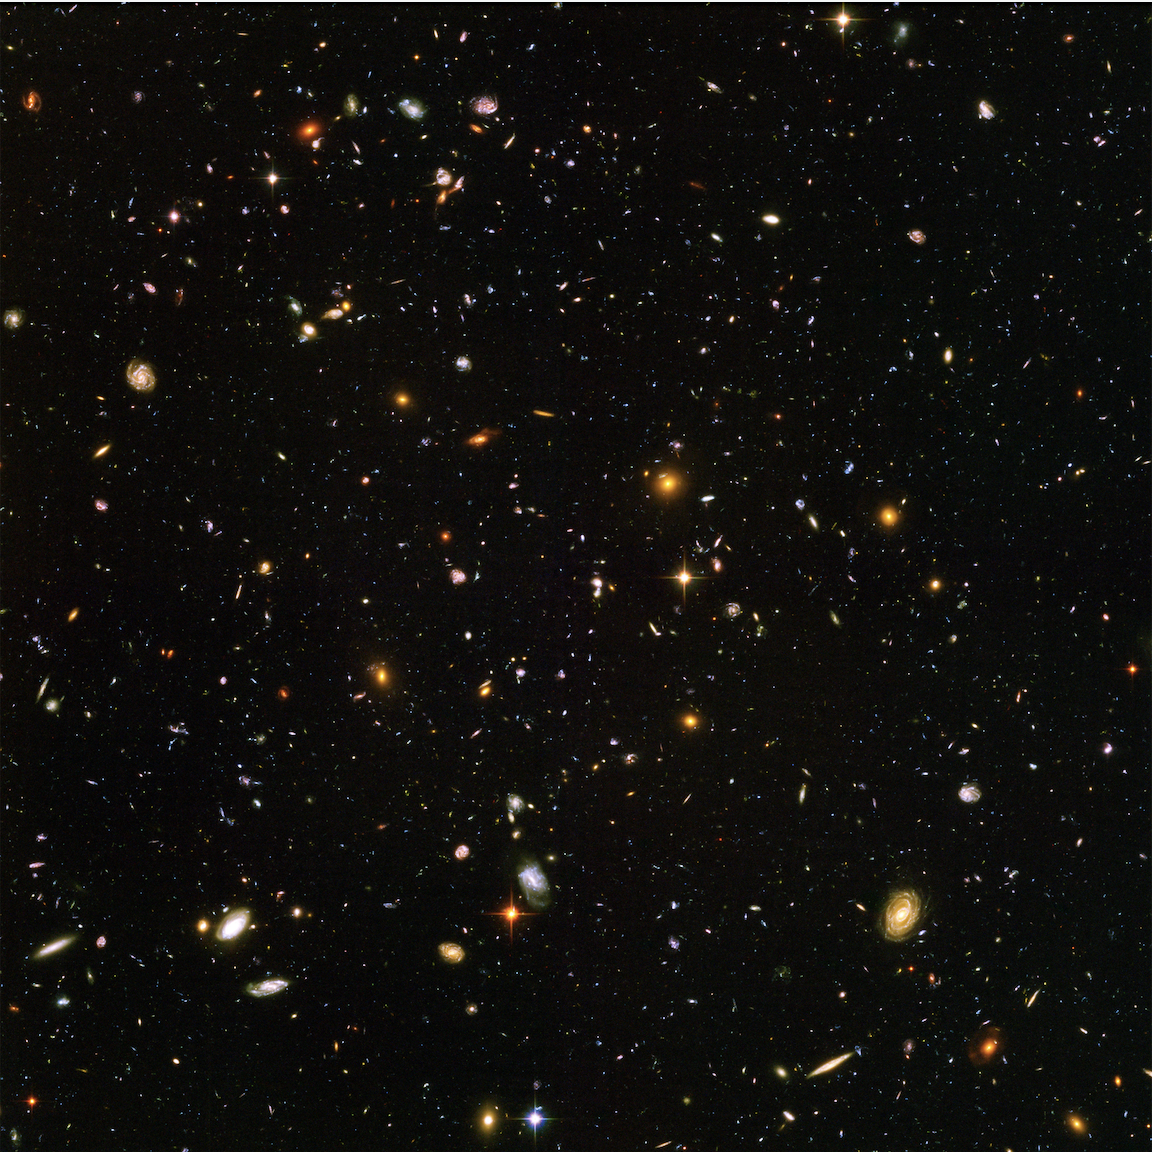
Figure 1: The Hubble Ultra Deep Field, one of a number of long-duration images taken by the Hubble Space Telescope. (Credit: NASA/HST.)
When we look up at the sky with telescopes, we see myriads of galaxies of differing sizes and morphologies (shapes). Galaxies on a large scale seem to be distributed uniformly, but on smaller scales get bound up into what is generally called “large scale structure” —enormous filaments of matter that have clumped together as the Universe evolves. You can see an example of what some of these galaxies look like in the image below, which is the famous Hubble Ultra Deep Field, taken over a region of the sky so small you could hold out a hand and blot it out with a fingernail.
As we look at this Hubble image, we can take note of the shapes and the distribution of shapes in this region. One of the key measurements of a galaxy’s shape is its ellipticity, which, to give a quick geometry refresher, is zero for a perfect circle and approaches one for a highly elongated shape. In the case of a galaxy, its ellipticity is a measure of how round it appears to us as we view it through a telescope — i.e. its shape projected onto the two dimensional sky.
One might guess that, for an array of galaxies, the average of all galaxies’ ellipticities would be zero over a large volume, because galaxies are seemingly randomly oriented. That is, it would look as if a galaxy is just as likely to be slanted in one direction as any other. To the naked eye, this generally seems to be true. However, this is not quite the case!
Galaxy shapes and distributions
Two major effects shift our locally averaged ellipticities away from zero:
- Light is pulled towards large distributions of matter, bending around them, as it passes through space, a phenomenon well-described by general relativity. So the light we see is more likely to be stretched into arcs circling partway around large massive structures that it is passing by (in the “foreground”), on its way to us, not unlike what we see looking at a background lightbulb through the base of a wine glass. This is known as gravitational lensing and, if we can measure it, will reveal significant information about the distribution of matter in the Universe.
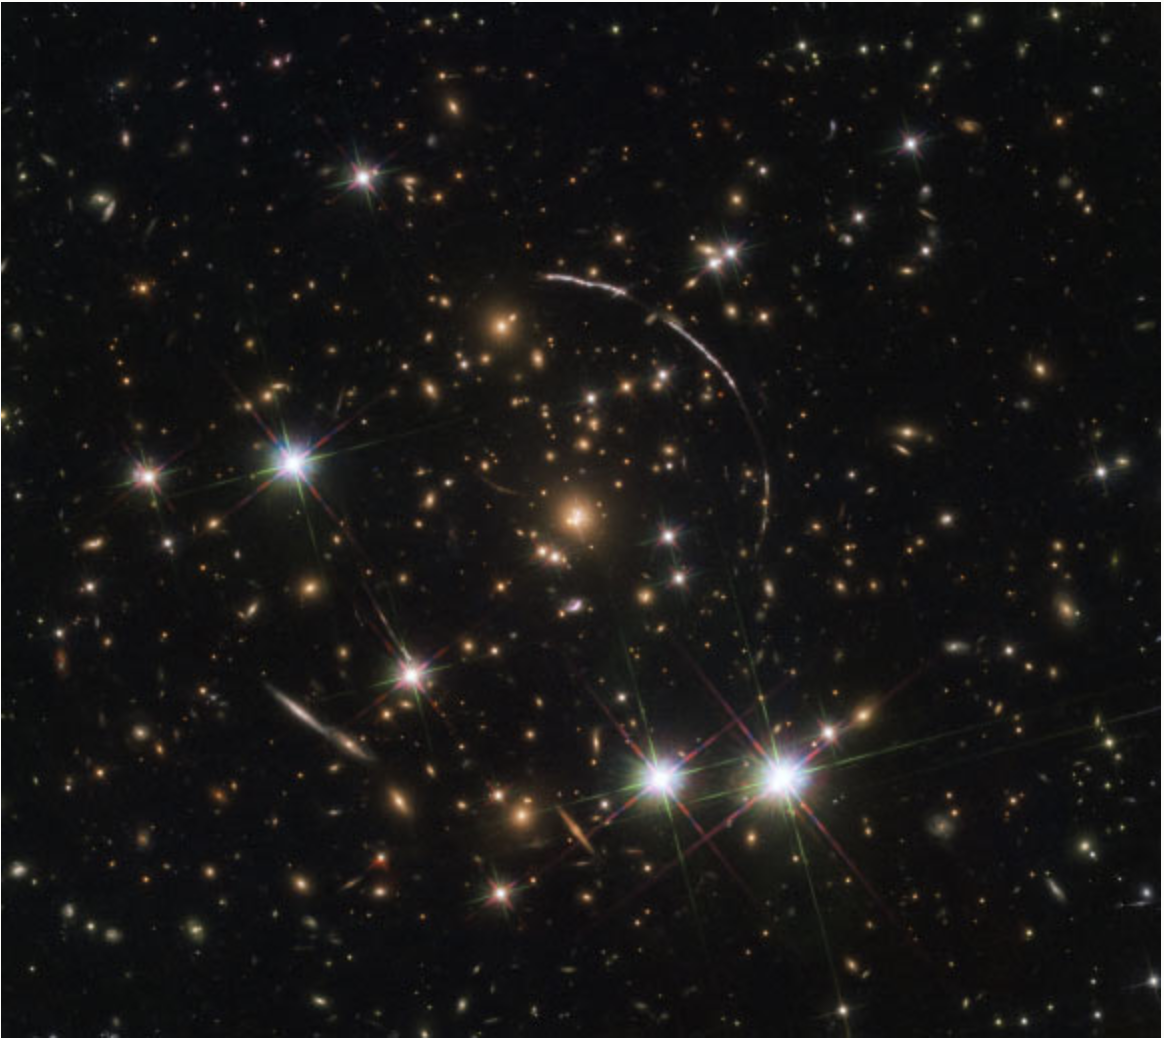
Figure 2: Another Hubble image, this time showing strong lensing features that present as long, curved arcs tangent to the foreground galaxy cluster (the large orange elliptical galaxies in the center of the field of view). These arcs (very visible to the upper right of the foreground cluster) come from ordinary-shaped galaxies behind the foreground structure. (Credit: NASA/HST.)
- Galaxies are gravitationally bound to each other in clusters, and exert influence on one another. This means that galaxies are more likely to orient themselves according to tidal forces in their cluster, like Earth’s oceans are tidally affected by the motions of our moon. This is known as “intrinsic alignment”.
Here, we will primarily be talking about the first effect, specifically about how we get to the shape measurement that lets us quantify weak lensing, which in turn informs our understanding of dark matter and structure.
However, the intrinsic alignment of galaxies is also very important to constrain in cosmology and still factors into our understanding of how shapes ought to be correlated with a given model. Namely, we have to subtract out the expected intrinsic alignment of galaxies when we look at the relationships between galaxy shapes and their neighbors. There are further technicalities, and it can get more complicated than this, because the amount of intrinsic alignment for a galaxy and its neighbors can also have a relationship with the galaxy’s color, as redder galaxies are generally more clustered and thus experience stronger tidal forces. While we will talk about weak lensing in the following sections, good intrinsic alignment models are essential to understanding our data, and there are several strategies to approach the problem that are still in development. (See the first part of this November, 2014 KIPAC blogpost by Josh Meyers for a little more information on lensing.)
Measuring shear from shapes
In the year three (Y3) analysis of the Dark Energy Survey (DES), more than 100 million galaxies were observed with shape measurements—a huge sample that gave us an unprecedented dataset to constrain the cosmology of our Universe. We can measure the shapes in our images, but we must relate those measurements to the underlying structure that can distort them. That is to say, we need to understand the responsiveness of a galaxy to an applied shear (gravitational lensing about a large mass), so that we can use our shapes to measure the lensing shear itself. This is known as “shear calibration”, and it involves a very good set of image simulations that look as close to the real pictures as possible. Figure 3, below, shows a side-by-side comparison of the DES image simulations with real data.
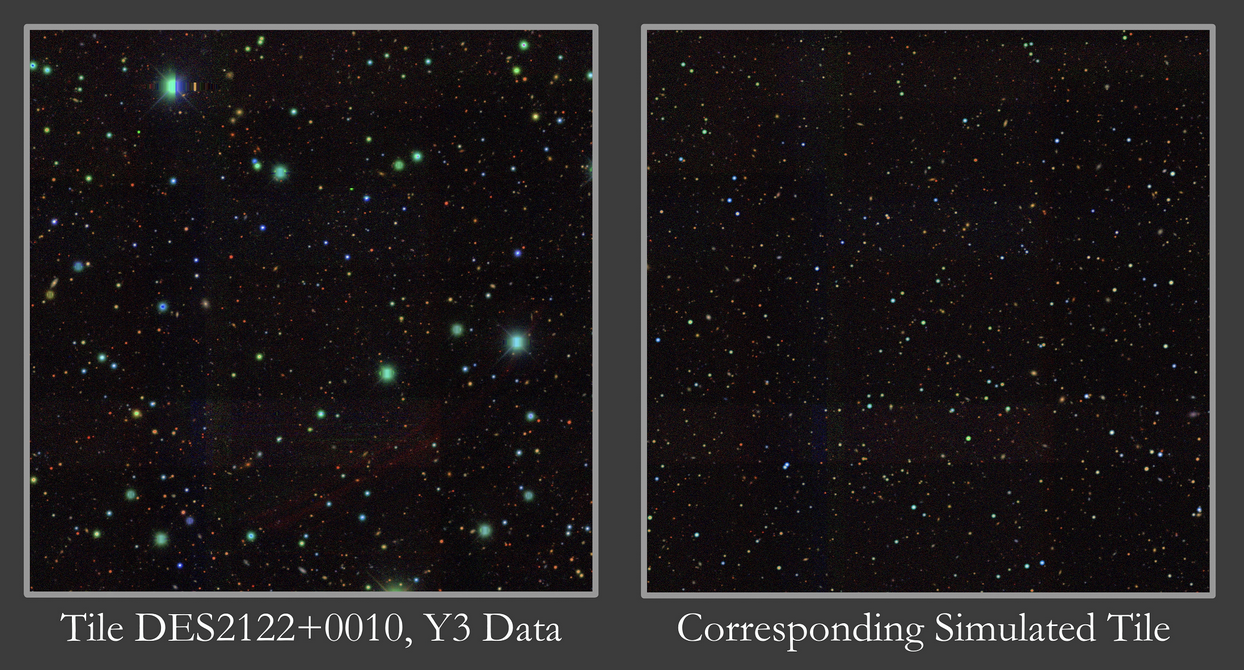
Figure 3: The left image shows real data, while the right image shows the equivalent simulated tile. Note that large foreground objects like stars our own galaxy are not simulated. In fact, these bright objects get masked out of our data analysis since they don’t tell us much about structure and are incredibly bright. Since we apply the same masks to the right hand tile, there’s no need to simulate them. (Credit: DES Collaboration, MacCrann, et al., 2021.)
With the same noise fields, exposures, galaxy colors, and general morphologies, as well as the same analysis pipeline as the data, we end up with a reliable set of galaxies that we can apply our own shear to. It is important that we know the true shear that we apply to an image, so that we can measure the response in shape. This lets us calibrate the responsiveness of ensembles of galaxies all at once. We measure the observed shape before and after shearing, and we have a change in shape per amount sheared in a given direction.
Blending and light mixing
To compare models against our Universe today, we often want to check predictions of structure over time against what we actually see in the Universe. Since light takes time to get to us, we can discuss the dimension into the plane, or the third dimension that the image flattens out, using both distance and time terminology; astronomers call this the redshift (a measurement of the object’s velocity away from us that is an analog for distance). Things that are further away from us are moving away faster, and also form a snapshot of a younger Universe. The further we look, the larger the total volume of galaxies we can see (imagine a sphere of increasing radius). As we look deeper into the past, or at fainter galaxies, we are much more likely to start having galaxies overlap with one another in our field of view. Their light blends together and it may be difficult to tell how many galaxies truly contribute to a single point on our detector.
We want our gravitational shear as a function of redshift (distance away from us) to compare to models of the evolution of real structure in the Universe. The amount of shape distortion we see is directly related to the distances between the source and the lensing matter, as well as the distance between the lens and the observer (us!). This makes the gravitational shear of large numbers of galaxies effective tracers of the mass distribution of the Universe, and if we have the shapes in bins of redshifts, we also get an understanding of the time evolution of that structure. To get this accurately, we ought to calibrate for the responsiveness of blended galaxies to shear, too. The concept of a detection being responsive is explored a bit more in the figure below, but at its simplest the amount of shape change we might expect in a galaxy that is lensed could be very different with different initial shapes, different detector properties, different color bands. We need to measure our survey-specific responsiveness to back out the real gravitational shears applied.
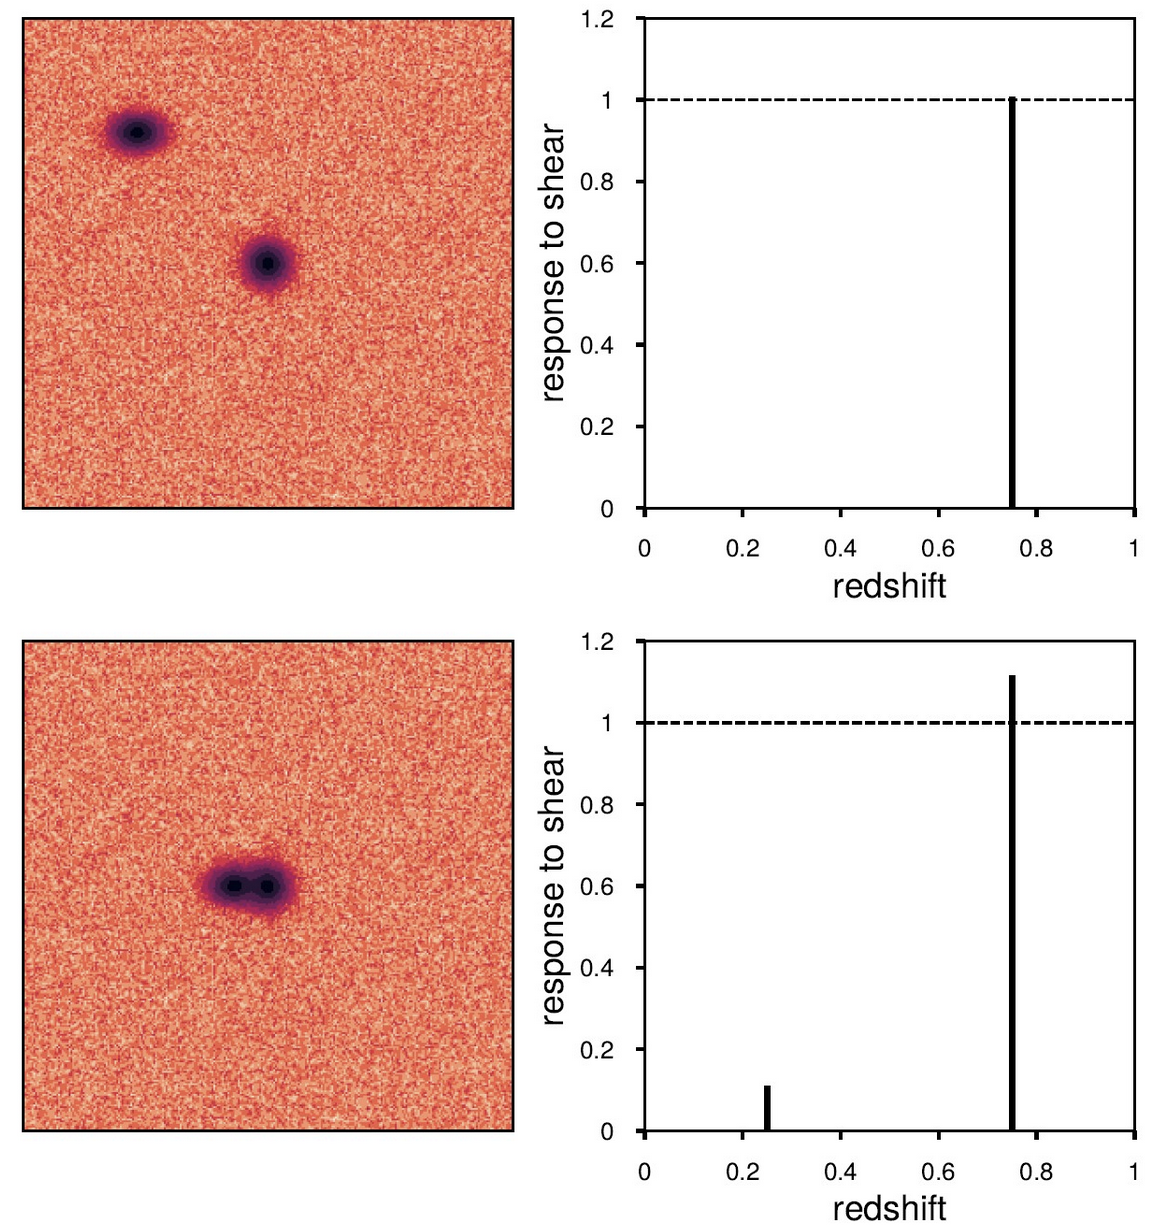
Figure 4: Image showing a low redshift (closer) companion blending with a higher redshift (more distant) galaxy. We see the biased response to shear at a given redshift in the bottom panel, which changes our effective redshift distribution for our gravitational shear. Many of these blends put together will change our ensemble distribution, and distort our understanding of the underlying cosmology if we have too many blends and do not model this effect in our simulations. (Credit: DES Collaboration, MacCrann et al., 2021.)
MacCrann, et al., (2021) is one of the first papers to really examine this with blending taken into account, by applying redshift-dependent shears to the image simulation suite for DESY3. The standard practice up to this point tended to be applying an artificial shear to the whole field in two directions and comparing that to an unsheared image to calibrate all the shape-to-shear responses in the survey.
However, blended galaxies will respond to shears at multiple redshifts (or distances) if the galaxies are far enough apart from each other and are merely projected onto the same point on the sky (see the figure below). This difference is invisible to us if we only shear the entire field at once. This will distort the gravitational shear signal with respect to redshift, because blending is much more common at higher redshifts. Our detections that are the furthest away will have the most bias that we need to account for. For future surveys that will look even fainter than DESY3, this effect will be much larger.
In summary, measuring galaxy shapes in large quantities (especially with good distance measurements) can lead us to a deeper understanding of how matter clumps together across space and time—telling us more about what our universe is made out of and the forces that shape it. Shapes are only part of the picture, however, and we need to know how galaxy shapes and colors respond to an artificial shear to back out the real gravitational shear in our data. Simulations are the key to getting this right, and with more complicated data that blend many sources together, we need to be careful of redshift-dependent effects and biases, which require even more simulations with even more artificial shears. With the advent of unprecedented data sets and more galaxy detections than we have ever had at our disposal, we will have to model and understand deeper and more complicated effects to best use that data.
DArchive Author: Jamie McCullough
 Jamie is a doctoral student at Stanford University, Ludwig-Maximilians Universitat, and SLAC specializing in weak gravitational lensing. She was involved heavily with the shear calibration for the DESY3 analysis and has expertise in getting accurate distances, or redshifts, to galaxies that we only have limited color information for. Her other research interests involve spectroscopic redshift searches on instruments like DESI and 4MOST, and the broader problem of blending for future cosmology surveys. In her spare time, she enjoys soccer, writing, and stargazing.