This Darchive describes how we remove biases in our galaxy catalogs for cosmological studies. It is based on this paper: https://arxiv.org/abs/2105.13540
In the first 3 years of its operation, the Dark Energy Survey took images of around 400 million galaxies in order to measure the effects of dark matter and research the nature of dark energy. For our conclusions and measurements of dark matter and dark energy to be as accurate as possible though, it’s best to use data with a focus on quality over quantity. This initial catalog of hundreds of millions of galaxies has to be refined to match our uses, so we split our data into more specific categories, like picking only ‘luminous red galaxies’, or filtering out data we aren’t really sure about. For example, some of the galaxies with noisier measurements might actually be stars, so we cut those objects out to make our data more accurate, among many other filtering steps.
We also split up our data based on the redshift measurements. The redshift helps us determine the distance to these galaxies. It can take billions of years for the light from these galaxies to travel to the Earth. Viewing these galaxies is like looking directly into the past. The redshift determines how far into the past we are looking (see Figure 1).
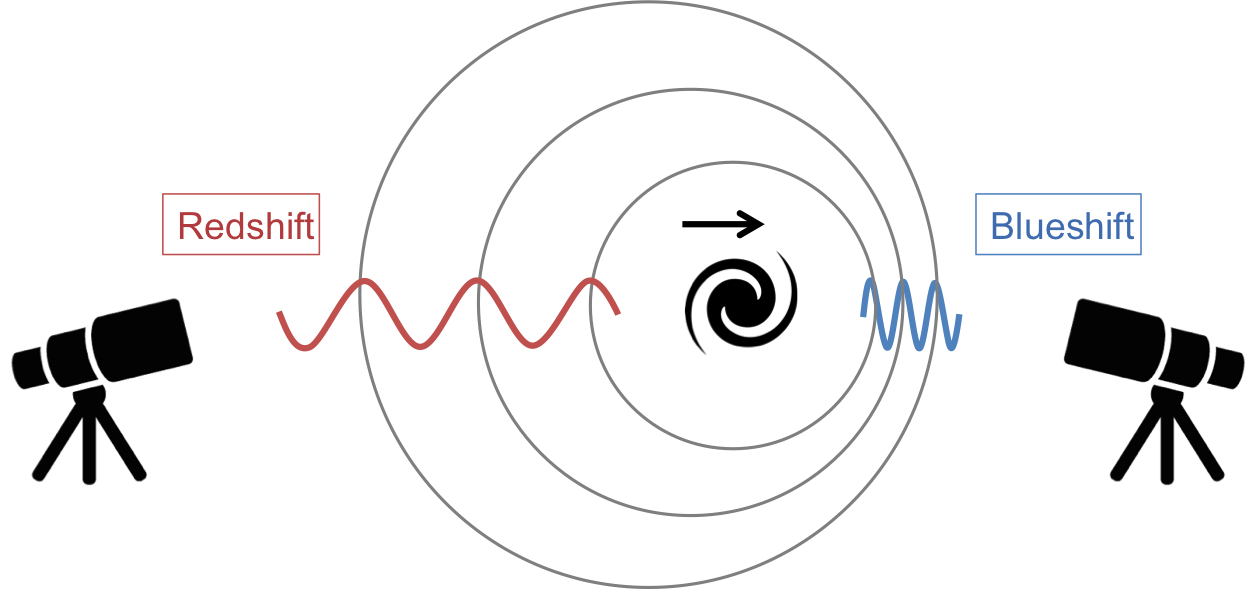
Figure 1: When an object that emits light is moving away from you, the wavelength of the light is elongated, making it appear more red. Since the universe is expanding, objects farther away in the universe are moving away more quickly than closer ones, meaning the light from those objects appears more red. This information, known as redshift, is used in astronomy to measure distance. Image credit: SDSS
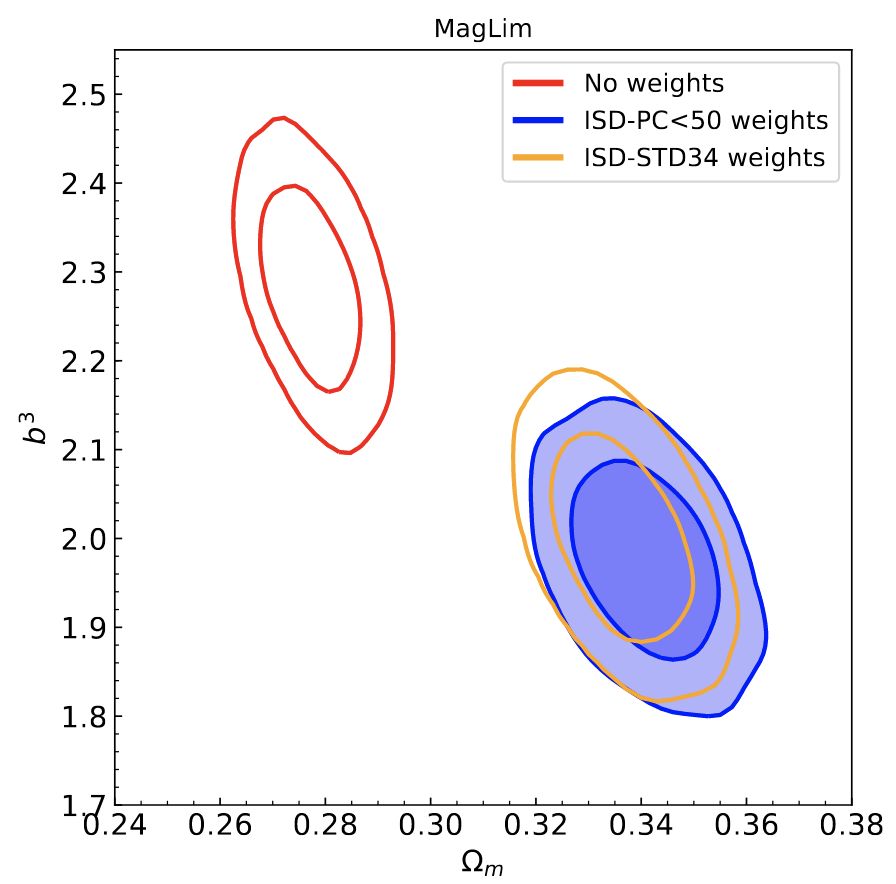
Figure 2: This graph illustrates the importance of eliminating contamination. The x-axis measures inferred matter density of the Universe, and the y-axis measures the galaxy bias. The yellow and blue contours apply ‘weights’ to decontaminate our galaxy maps from dozens of factors. The red contour has no decontamination. As you can see, the contaminated data in red has larger galaxy bias values and smaller matter densities than the corrected data does.
Even after some of these selections, we know of several factors that may still be biasing our galaxy catalogs and our measurements on them. Accounting for these ‘systematic’ issues is the focus of this DES paper by Martín Rodríguez-Monroy and collaborators. In this work, we first discard data where we experienced processing issues, or sections that weren’t fully observed. Once we’ve cut out the lowest quality data, we have to work on accounting for further contaminating effects, like clouds in the atmosphere, turbulent airflow (causing an effect called seeing) or space dust (which causes an effect called extinction) among other issues. These contaminants can block out or alter light coming from galaxies, creating inaccurate measurements of the number of galaxies in a certain part of the sky. Not accounting for this contamination leads to significant biasing of our cosmological analyses. On the right-side of Figure 2, the blue and yellow measurements are examples where contamination of the data was taken into consideration and filtered out, whereas the red contour on the left has none of the contamination filtered at all. Notice how accounting for the contamination significantly changes the measurements.
In order to cut out that contamination, we created templates that attempt to map objects like space dust and clouds, among other contaminants. One such map is in Figure 3. By measuring correlations between these ‘template’ maps of contaminants and our galaxy maps, we can subtract these contaminating effects from the data (a cartoon depicting this is in Figure 4).
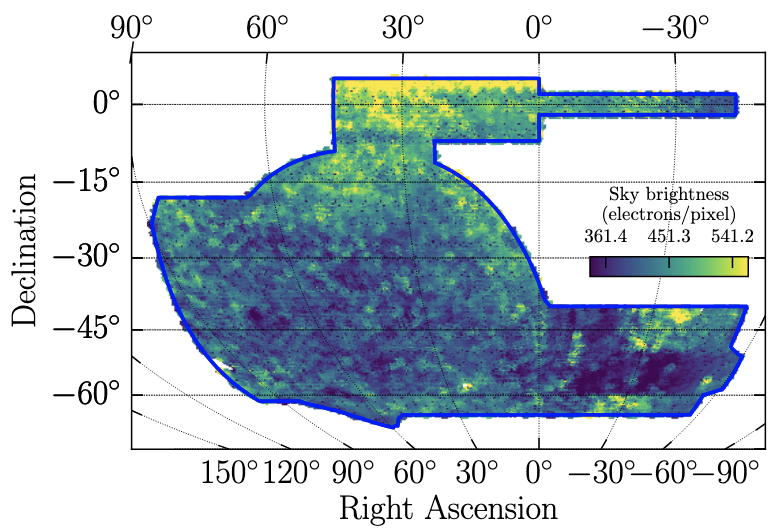
Figure 3: This is an example of one of the contamination maps which indicates the average brightness of the sky during observations in different parts of the sky.
Figure 4: This picture illustrates various types of contamination that can interfere with our data. Our view of distant galaxies can be obscured by stars in our own Galaxy, asteroids and other materials in our Solar System, human-made satellites and planes, and clouds and turbulence in the Earth’s atmosphere, among other factors. Image credit: Jessie Muir
However, data can also suffer from overfitting. Cutting out too much ‘contamination’ can result in cutting out actual galaxy data instead of just space dust and the like. As such, we have to carefully select which templates to use to retain as much accurate information as possible. To correct the contamination, we use a technique called Iterative Systematics Decontamination or ISD. This method identifies the most significant template, obtains a weight map which identifies if there should be more or less galaxies per pixel based on the contamination, applies those weights to the data, and repeats the process on all templates above a certain significance threshold.
To make sure our template maps weren’t overcorrecting the data, we created mock galaxy data maps with an ‘aggressive’ amount of contamination. When we apply the templates to these overly contaminated mocks, we expect this data to be undercorrected. If it seems to be well, or worse, overcorrected, we know our templates are overcorrecting and cutting out real galaxy data, and we have to revisit our template maps and modify our process to remediate the overcorrection. When we conducted this test, it produced the undercorrection we expected, confirming our templates would not overcorrect our data.
In all, we found that the ISD method was successful in removing systematic contamination and didn’t produce significant bias, allowing our measurements to give us as much information on dark matter and dark energy as possible (in this paper and others).
DArchive Author: Ellesa Henning
 Ellesa is an undergraduate student at William Jewell College in Liberty, Missouri and is doing research with the DES large-scale structure group. She has been interested in astrophysics since she was assigned a brief research paper on black holes in middle school. She enjoys boba tea and learning the Arabic language. She also has a tortoiseshell cat named Stardust.
DArchive Editor: Ross Cawthon
 Ross is a professor at William Jewell College in Liberty, Missouri. He works on various projects studying the large-scale structure of the Universe using the millions of galaxies DES observes. These projects include galaxy clustering, correlations of structure with the cosmic microwave background and using the structure of the Universe to infer the redshifts of galaxies. Ross also coordinates Education and Public Outreach efforts in DES, including managing the darchives and social media.