This darchive discusses work from a few DES papers in describing how we learn about dark matter (and indirectly, dark energy) with DES galaxies.
After six years of mapping the sky, the Dark Energy Survey (DES) has produced one of the best guides to the universe. The survey has observed 5000 square degrees (1/8th of the entire sky) to a depth that surpasses previous wide-field surveys. While most of the data is still being analyzed, we already have seen the first public data release, which contains more than 400 million objects, with more than 300 million of them expected to be galaxies.
While this incredible census of objects is an accomplishment itself, for DES cosmologists trying to understand the workings of the Universe, it is not enough to know just where these objects are. We know from many pieces of evidence (e.g. gravitational lensing, rotation speeds of galaxies) that most of the matter in the Universe is dark matter, and emits no light. Current estimates state there is about six times as much dark matter as visible matter. Measuring the statistical properties of the full distribution of matter in the Universe (referred to as ‘large-scale structure’) informs cosmologists about the properties of dark matter, the laws of gravity (general relativity), the expansion of the Universe, and of course, properties of dark energy, which is the driving force of cosmic acceleration. (We are the Dark Energy Survey after all!)
With 5/6th of the matter in the Universe being dark, understanding large-scale structure is difficult. How do you study something you cannot see? You study what you can see that may be influenced by what you cannot. There are primarily two techniques for inferring where dark matter is on large (intergalactic) scales. The first is to assume that massive objects you can see (e.g., galaxies, galaxy clusters), trace where the dark matter is. The second is gravitational lensing.
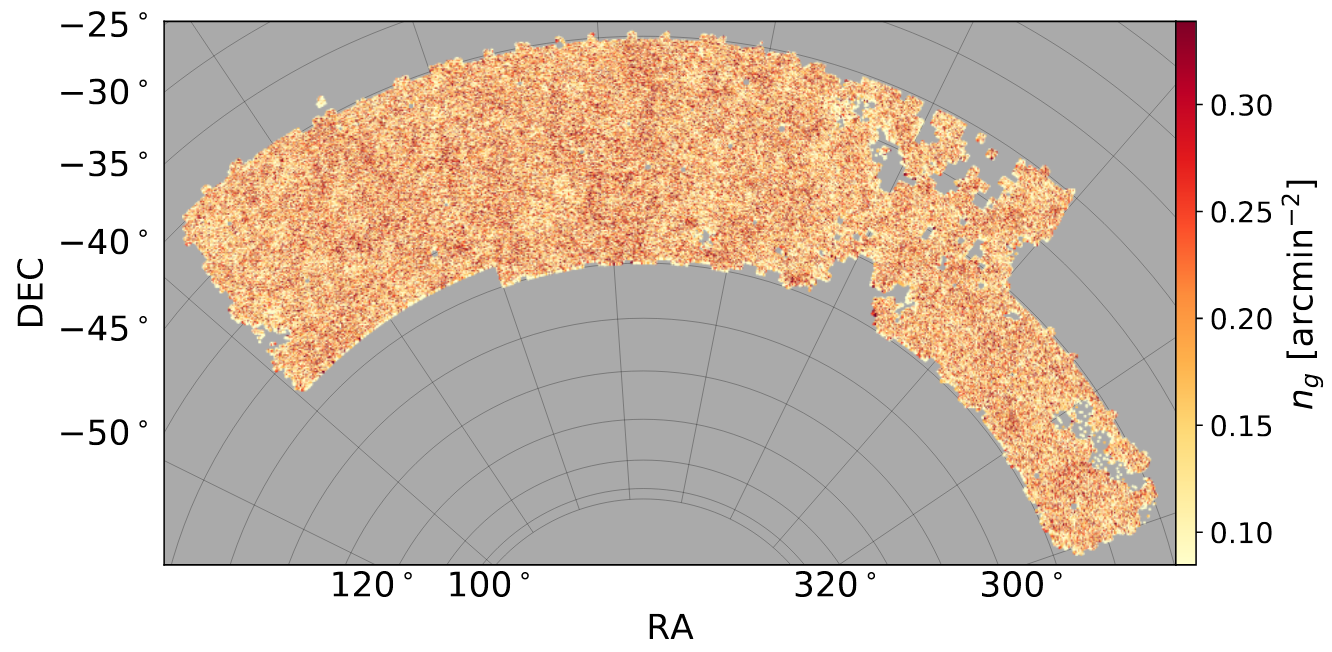
Figure 1: A map of galaxy density for Redmagic galaxies in DES Year-1 data. The color bar represents density of galaxies.
DES used both of these techniques to map dark matter in its analysis of Year 1 data. In Figure 1, we see a map of the distribution of red galaxies as found by the ‘Redmagic’ algorithm described in this paper. The sample contains more than 600,000 of these red galaxies (a small fraction of the total number of galaxies observed by DES). The colors show the deviations in density of galaxies, with red areas illustrating the most dense patches. Many studies show that the density of galaxies does trace the density of dark matter, but there are differences between the distributions which is known as ‘galaxy bias’. The galaxy bias is often difficult to pinpoint (see, e.g., this Darchive) and is different for galaxies of different masses, and perhaps other factors. So we can think of this map of galaxies as, at best, a blurry picture of the distribution of dark matter.
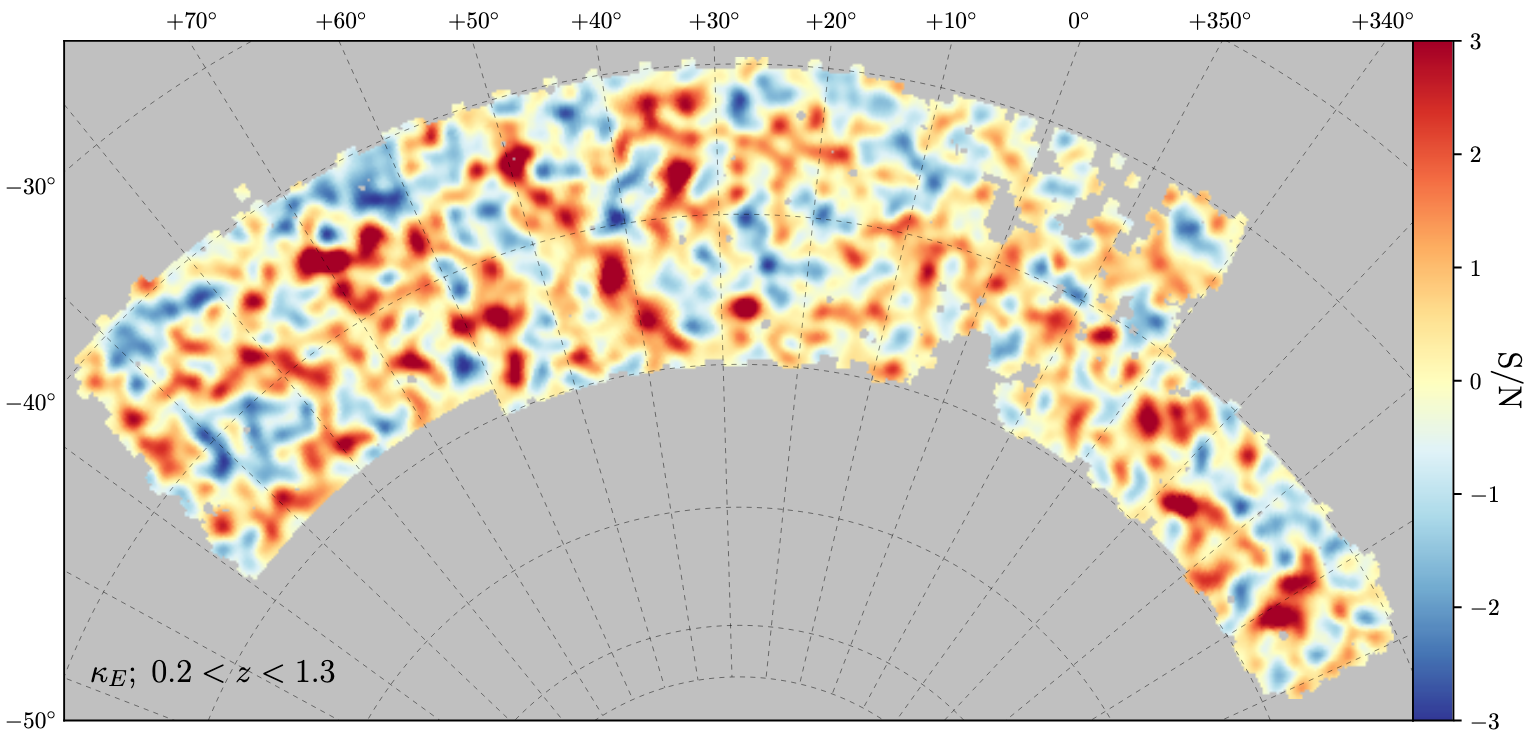
Figure 2: A ‘mass map’ showing inferred mass from weak gravitational lensing measurements on DES Year-1 galaxies. Red signifies higher density of mass.
The second technique for mapping dark matter is gravitational lensing. All mass (visible and dark) can bend or ‘lens’ the trajectory of light rays. If light from a distant galaxy passes by some massive object on its way to us, its appearance will be distorted. For most galaxies, this distortion is a very small effect (~1% change in apparent shape of the galaxy). DES measured these small lensing effects (called weak gravitational lensing) on more than 30 million galaxies. Combining these measurements, we were able to see which patches of the sky were more dense than others, and generate a ‘mass map’ (Figure 2 in this paper). This lensing-based mass map is sensitive to all matter. However, since dark matter makes up most of the mass in the Universe, this is primarily a dark matter map. The downside of lensing is that this effect is very small, making the measurements noisy and less precise. The galaxy maps (Figure 1) are more precise, but we know they are somewhat offset from the dark matter. Thus, each type of map has its advantages and disadvantages.
DES used these maps of galaxy locations and gravitational lensing signals to measure fundamental properties of the Universe. In particular, these maps allowed DES to determine how statistically clustered or smooth matter is as a function of time. DES measured how clustered the Universe appears in the galaxy and mass maps at different redshifts, which signify different epochs of the Universe. Figure 3 (from this paper) shows these measurements for the galaxy maps. The y-axis shows how clustered the galaxy samples are. As the panels go from 5 to 1 (right to left), they are measuring later and later (more recent) epochs of the Universe. We see that as the Universe evolves from panel 5 to panel 1, it gets more clustered. Due to gravity, galaxies are on average being pulled into larger and larger clusters, and also leaving more ‘void’ areas of space with very little density behind. The measurements made from gravitational lensing also show this trend.
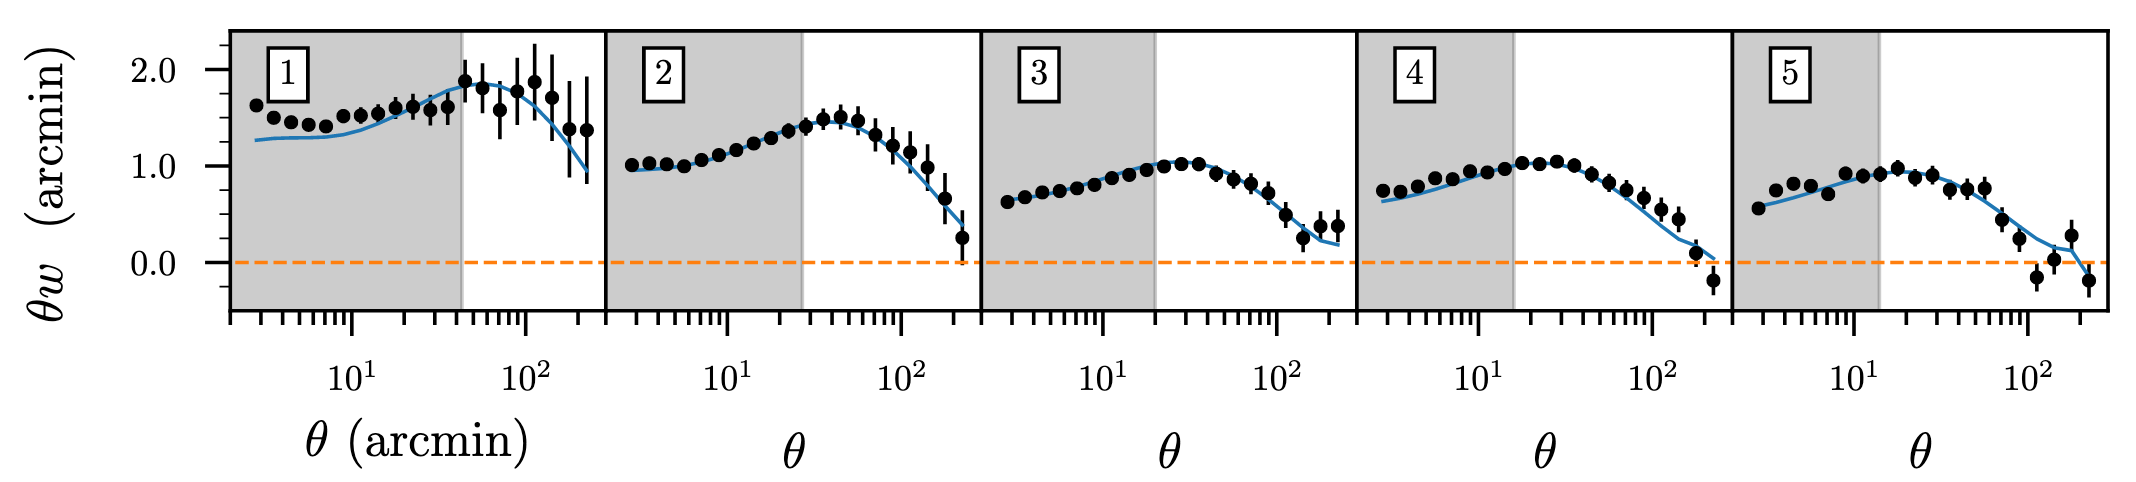
Figure 3: Measurements of the clustering of DES Year-1 galaxies. Each panel is a different range of redshifts, representing a different epoch of the Universe. Bin 1 (left) is the lowest redshift and most recent time. It shows the most clustering. The y-axis measures clustering, and the x-axis is angular scale. The black points are the data and the blue line is the best fit model to the data.
DES made very precise measurements of galaxies and lensing at different redshifts. Those measurements led to Figure 4 (also from this paper), an estimate for the overall matter density of the Universe (x-axis) and how clustered or ‘clumpy’ the Universe is today (y-axis). These are the best measurements to date from a galaxy survey. We can see that these parameters are also measured by Planck, a satellite experiment that studies the cosmic microwave background and measures these parameters in a very different way.
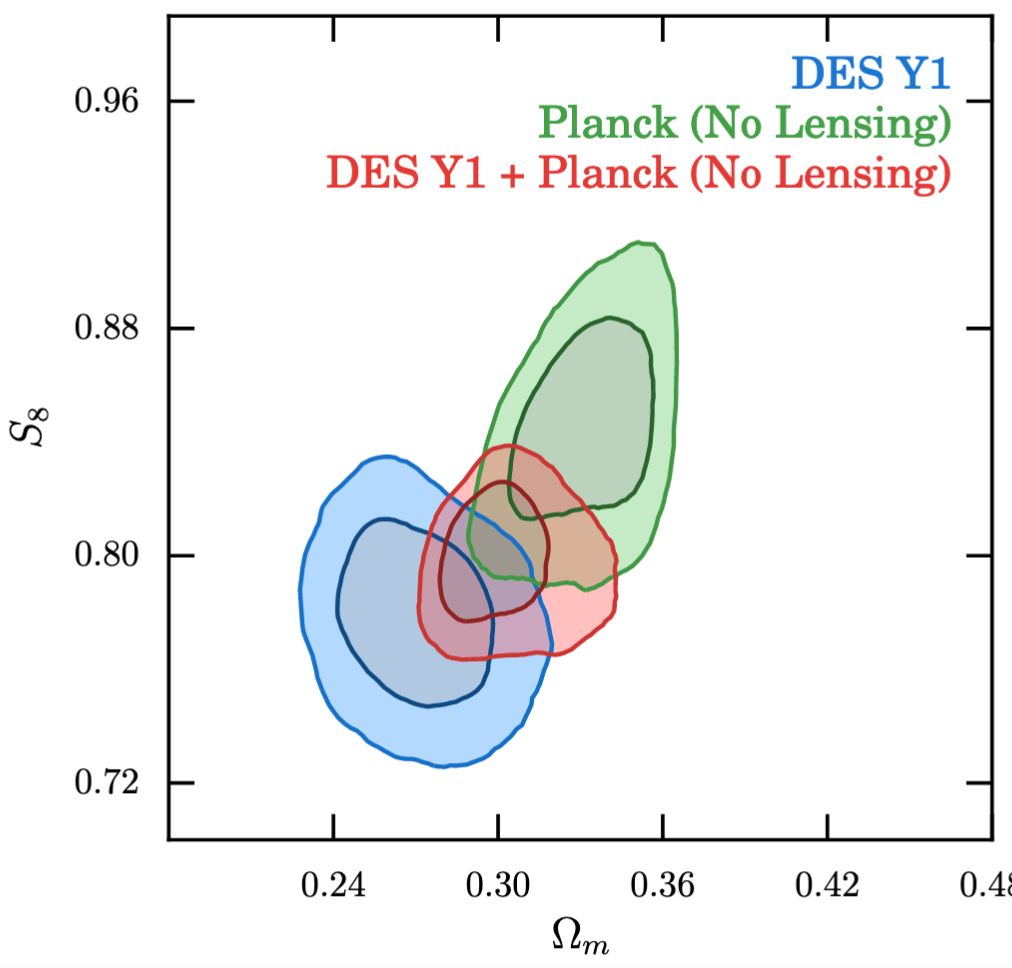
Figure 4: Measurements of ‘S8’ (y-axis, a parameter showing how clustered or clumpy the matter distribution of the Universe is) and ‘Omega_m’ (x-axis, a parameter showing the total mass density of the Universe’). Blue shows the measurements by DES using galaxies and weak lensing. Green shows the measurements by the Planck satellite that studies the cosmic microwave background. Red shows the combined measurements. The size of the contours represent the 68% and 95% uncertainties. e.g., the DES analysis says that there is a 95% chance that the exact values of S8 and Omega_m are somewhere in the larger blue contour.
The two results somewhat agree (i.e. the blue and green contours which show the effective uncertainties of the measurements overlap a bit), but are also different in their central values (i.e. the blue and green contours are not exactly on top of each other). Cosmologists are very interested in what the next DES results will be. As we make new measurements, the uncertainties (the size of these contours) will shrink. If they shrink and do not match the results from the cosmic microwave background, it could be a sign that our present model of the Universe (including dark energy) is missing something. This plot was discussed in more detail in this Darchive.
Expect new maps and measurements from DES with more than three times the data shown here! We again will be mapping the light to understand the dark (both matter and energy).
DArchive Author: Ross Cawthon
 Ross is the author of this Darchive, and a co-author on all of the papers mentioned in this work. He is a postdoctoral researcher at the University of Wisconsin-Madison. He works on various projects studying the large-scale structure of the Universe using the millions of galaxies DES observes. These projects include galaxy clustering, correlations of structure with the cosmic microwave background and using the structure of the Universe to infer the redshifts of galaxies. Ross also coordinates Education and Public Outreach efforts in DES, including managing the darchives and social media.
DArchive Editor: Sunayana Bhargava
Sunayana co-edited this Darchive. She is a PhD candidate at the University of Sussex working under the supervision of Kathy Romer. Her research interests involve using clusters of galaxies as cosmological probes, combining X-ray and optical data.
Darchive Editor: Chihway Chang

Chihway co-edited this Darchive and was the lead author of the featured Weak Lensing Mass Map paper. She is an assistant professor in the Astronomy and Astrophysics Department at the University of Chicago and the Kavli Institute of Cosmological Physics (KICP). She moved about 20 meters from her previous position as a KICP Fellow Oct 2018. Before that, she was a postdoc at ETH Zurich and did her PhD at Stanford University. Chihway is an observational cosmologist that uses large datasets from galaxy and CMB surveys to investigate cosmological and astrophysical questions. Most of her work centers around the theme of weak gravitational lensing, where the shapes of millions of galaxies statistically inform us about the content and the history of the Universe.