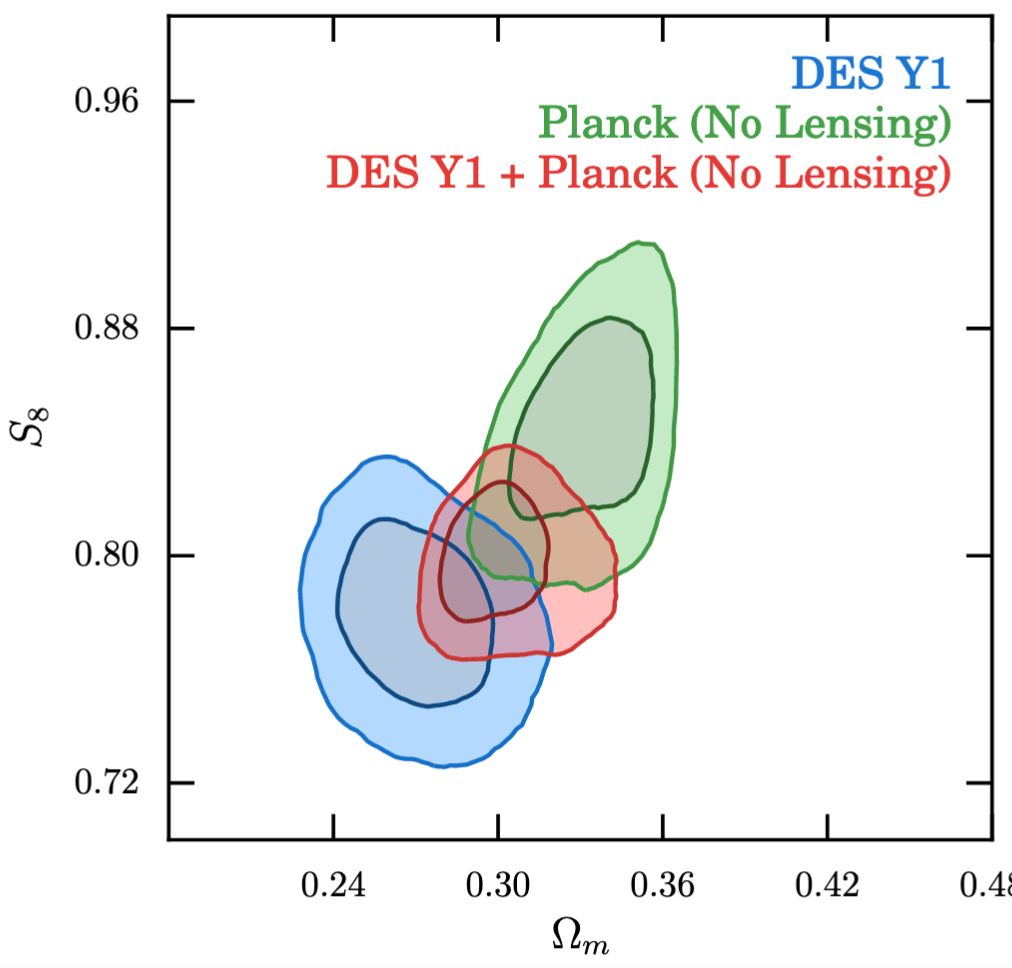
Figure 1: Preferred results for matter ‘clumpiness’ on the y-axis vs. density of total mass on the x-axis in 2 different cosmology experiments, and in their overlap (see Fig. 10 of the full paper).
For decades, cosmologists have been attempting to piece together the history and composition of the Universe. This is a very difficult task because we know that ~95% of the Universe comes from the invisible “Dark Sector”, i.e. from dark matter and dark energy.
In a series of ten journal papers released on August 3rd, 2017, scientists from the international Dark Energy Survey (DES) collaboration shed new light on the Dark Sector. These insights were derived by applying a statistical technique known as two point correlation functions (or “2pt” for short) to an enormous catalog of galaxies. In fact, three different 2pt’s were used, two of which take advantage of the superb information that DES delivers about the shapes of galaxies. This shape information encodes clues to the dark matter distribution through the process of gravitational lensing.
The culmination of all this work can be seen in Figure 1, where each shaded region represents the values of the parameters on the axes that are favored by the different experiments. We realize that to the untrained eye, this Figure won’t mean a great deal right off, but by bringing your attention to five of the most important aspects, we hope we can give you a bit more insight into it.
First, consider the partially overlapping ellipses (one green, one red, one blue). The blue ellipse on the lower left represents the results obtained by DES using the three different 2pt functions mentioned above. The green ellipse on the upper right represents results obtained by the Planck satellite mission (named after one of the fathers of modern physics). Whereas DES is sensitive to radiation in the visible part of the spectrum, the instruments on Planck were sensitive to microwave radiation. The red ellipse in between the other two represents what happens when the results from DES and Planck are combined.
Second, notice that the blue ellipse and the green ellipse cover similar areas. In figures like these, it is the size of the ellipse that indicates the precision of the measurement. Since the ellipses are similar sizes, we can conclude that DES and Planck projects have delivered similar precision. The fact that the red ellipse is smaller shows that by combining the data from two different experiments we can obtain higher precision.
Third, note that there are darker central regions in all three ellipses. Statistically speaking, we predict odds of 2 to 1 that the true values of the two parameters being tested are within these darker regions. If we include the outer region, we predict even better odds: there is only a 5% chance that the true value falls outside. (If you are struggling to get your head around this concept, check out the height vs age charts published by the World Health Organisation to see a real world analogy.)
Fourth, check out the horizontal axis label: Ωm. This symbol is cosmologist shorthand for the total mass density (normal matter along with dark matter) in the Universe. It doesn’t have a unit (such as kilograms per meter-cubed) because it is a relative measurement so all the units have canceled out. In cosmology, we compare the density we measure to a special value, known as the critical density. If Ωm is greater than one, then the Universe is heavy enough to collapse back on itself in a big crunch (which would occur in the extremely distant future). However, the measurements from DES and Planck have shown that Ωm is definitively less than one. From the red ellipse, we can see that there is a 2 in 1 chance of Ωm being bigger than about 0.29 and less than 0.33 (darker red inner ellipse). There is only a 5% chance that Ωm is less than 0.28 or more than 0.36 (lighter red outer ellipse).
Fifth, look at the vertical axis label: S8. This symbol is cosmologist short hard for the “clumpiness” of mass in the Universe. A low value of S8 would mean that the density is very similar everywhere (akin to a bowl of porridge). A high value of S8 would mean the density varies a lot from place to place (similar to a bowl of cheerios in milk). Similarly to Ωm, S8 does not have units. However, unlike Ωm, which describes the density of the Universe today, S8 describes how the density clumps just after the Big Bang, i.e. 13.7 billion years ago. The measurements from DES plus Planck have shown that S8 has a 66% (95%) chance of having a value between about 0.78 and 0.81 (0.77 and 0.83). Note that, unlike the case of Ωm, there is no special value of S8 that would result in a catastrophic end for the Universe.
In summary, Figure 1 tells us not only how much dark matter there is in the Universe but how clumpy that dark matter is. The precision of the DES results (i.e. the smallness of the blue ellipse) is unprecedented from an experiment on the ground. The only previously comparably precise results were obtained from space by Planck. You might well ask why the DES results are so important, if Planck had already achieved something similar? This was beautifully explained in the press release that accompanied the papers:
“Imagine planting a single seed and, with great precision, being able to predict the exact height of the tree that grows from it. Now imagine traveling to the future and snapping photographic proof that you were right”.
In this analogy, the seed was planted nearly 14 billion years ago! The Planck satellite measures the Universe at this early time when barely a sprout has sprung, while DES measures the Universe billions of years later, when the ‘seed’ has matured into a fully old-growth ‘tree’.
You might also well wonder why the green ellipse in Figure 1 doesn’t exactly line up with the blue one. Well, that is telling us that either the model we used to predict of the height of the tree wasn’t completely accurate, or that we didn’t make accurate enough measurements. Perhaps we hadn’t zeroed the scales properly when we weighed the original seed. Or perhaps we forgot to account for the length of grass around the tree’s base. When it comes to precision cosmology, the devil is in the details. Fortunately, the results presented in the blue ellipse in Figure 1 were based on less than a quarter of the data that will eventually be available to DES scientists. The team behind DES are already hard at work trying to resolve those devilish details. By now 80% of the raw DES data have been taken (but will require much processing to be ready for the level of analysis that went into the Y1 results), the remaining 20% will be gathered nightly in Chile until mid-February 2018.
What will an analysis of the full DES data set reveal? Will it show closer agreement to Planck — or the opposite? As yet, no one knows. Indeed, therein lies the beauty, magic, mystery, and adventure of doing experimental science! We are an intrepid and unstoppable species, irrepressible in our drive to stumble about the dark searching for the truth, doing the best we can while bruising our shins and bloodying our knuckles on the rocks about us, trying to figure out: where we are, where we came from, where we’re going — and why. The results from DES shown in Figure 1 mark a significant step forward in elucidating one section of the frontier of that unknown, but work remains. More exploration must be done…. Onwards!
Further Reading:
The original version of this article which contained significantly more technical detail on the analysis methods (Sep 4, 2017, by the same authors and editors)
Nice Astrobites article (with several more embedded images) on the DES Y1 results (Aug 14, 2017, by Gourav Khullarr)
Excellent article (with embedded video) on an originally Australian research-publicizing website (Aug 8, 2017, by Australian professor Tamara Davis)
About The DArchive Authors
Mandeep Gill is a staff researcher at Stanford University. He has worked on the master lens database for the Strong Lensing group, did initial work on a pipeline option for the Weak Lensing group, and more recently worked with the gravitational wave event optical follow-up group, as well as was an internal paper reviewer for several now-published Strong Lensing papers. Further, he has taken a 10 day shift at Cerro Tololo Inter-American Observatory (CTIO), and is active in several Education and Public Outreach projects.
Michael is a physics PhD Student at Stanford University studying the large-scale structure of dark matter in the universe with DES. Along with his advisor Prof. Aaron Roodman, he’s using the galaxies observed by DES to study the underlying “cosmic web” of dark matter, as well as studying the impact of imperfections in telescope cameras (including our own DECam) on astronomical measurements.