This DArchive describes the detection of a feature known as the “splashback radius” of galaxy clusters as seen in DES measurements of galaxy density and gravitational lensing. This splashback radius is a way to quantify the size of a galaxy cluster. More details can be found in the paper “The splashback feature around DES galaxy clusters: galaxy density and weak lensing profiles.”
The Dark Energy Survey (DES) studies many different types of objects in order to understand the Universe. Among these are galaxy clusters, massive objects made up of many galaxies. Galaxy clusters are interesting because they tell us some fundamental properties of the Universe. These include the ratio of baryonic (visible) matter to dark matter and the distribution of the most dense regions of the Universe that tend to host these clusters.
However, a tricky problem that arises for galaxy clusters is defining a boundary between what is internal to the cluster and what is external to it. This is crucial for quantifying information about clusters. One intriguing way to define the boundary is what is known as the splashback radius. Galaxies living in the cosmic web are continuously being gobbled up by nearby clusters due to gravity (in a process known as accretion). The galaxies fall into the gravitational “well” of the cluster, and orbit around the center of mass of the cluster, just like how a basketball can spiral into a hoop or a coin spirals into a wishing well. The splashback radius is defined as the distance from the center of the cluster that galaxies reach once they have accreted onto the cluster and have passed by its center one time. So they fall into the gravitational well, and “splash back out” again.
Using the splashback radius to define the edge of a cluster is interesting because it is a naturally defined, physical scale. This is in contrast to the more commonly used definitions of cluster edges (so-called mass definitions). These include edges inside which the density of the cluster is some multiple of the average density of the universe (e.g., 200 times or 500 times the density of the universe). These types of definitions are somewhat arbitrary and are not sensitive to the internal physics of the cluster (which can also be a good thing, sometimes). On the other hand, the splashback radius may be related to too many properties of the cluster, such as its accretion history. This makes it difficult to make further conclusions about the internal workings of the cluster. Scientists are still studying the question of how much cluster physics can be determined by studying the splashback radius.
In this paper, Chihway Chang, Eric Baxter and their collaborators parsed the DES data around galaxy clusters to find evidence of the splashback radius, and came away quite successful. They looked at two observational signatures: the galaxy density around the clusters and the weak gravitational lensing signal. The galaxy density is straightforward to understand – it is the number density of galaxies in annuli around the centers of the galaxy clusters. It is found by drawing rings (annuli) around the clusters, counting the number of galaxies inside each ring, and dividing by the area of the rings. The weak gravitational lensing signal is a little bit more complicated. When observing objects behind the cluster, the light from those objects becomes bent by the gravitational pull of the cluster as it travels to our telescope. This very slightly distorts the image, hence the “weak” nomenclature. However, since many hundreds or thousands of background galaxies can be observed behind any given cluster, we can combine these many weak signals in order to observe a clear signature of gravitational lensing. Further, this lensing signal depends on the distribution of matter in the clusters responsible for the distortion, and hence can be used to identify the splashback radius.
Using 3,684 clusters spread out over the 1,297 square degrees of the DES Year 1 footprint, the authors combined the galaxy density and lensing signals of these clusters and found compelling evidence for the existence of the splashback radius. Figure 1 shows their model fit (red line) to both signals in the top panels, and the difference between the model and the data points in the lower panels. The fact that the differences are scattered around zero indicates that the model is doing well.
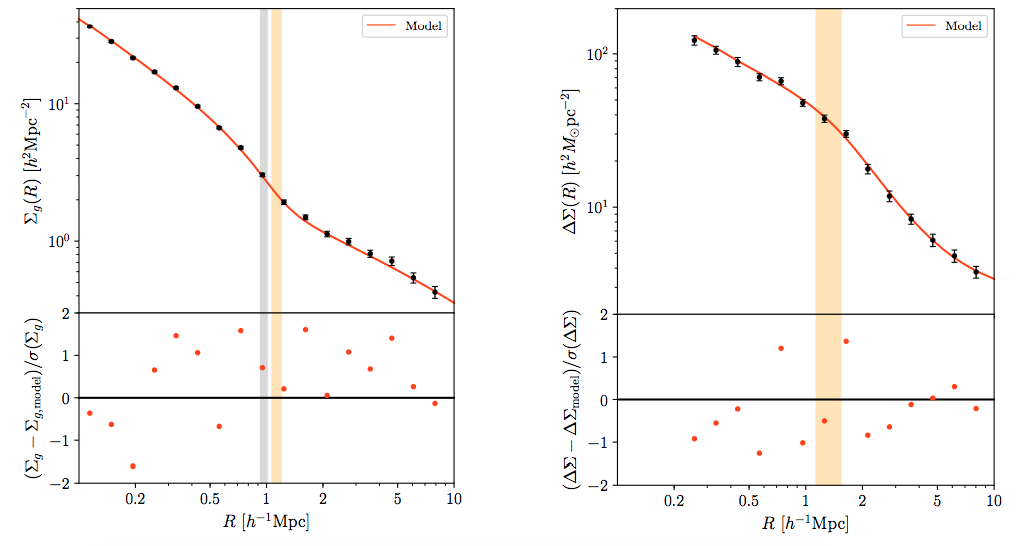
Figure 1 (Figures 2 and 3 in the paper): Top panels: Model fits to the galaxy density (left) and weak lensing profiles (right) both as a function of radial distance from the center of the cluster in Mpc (megaparsecs). Data points with error bars are in black, and the model is in red. Lower panels: The difference between the data and model normalized by the errorbar. The fact that the differences are scattered around zero indicates a good fit. The gray band is the splashback radius in the model (red line). Both measurements are “in projection” meaning they are measured as a function of separaon on the sky, not as a function of the true 3D distances from the center of clusters. The orange band represents the most likely splashback radii in 3D given the model.
One other question the authors sought to address was the issue of whether the observed splashback feature could in fact be a spurious systematic effect due to the particular cluster finding algorithm. In a nutshell, the particular algorithm used to identify galaxy clusters, known as redMaPPer, finds red galaxies in the DES data and draws circles around them to figure out which galaxies are near each other and thus in a cluster. This process of drawing circles around the galaxies may artificially introduce a feature similar to the splashback radius. Chang, Baxter and their coauthors tested whether changing the settings in redMaPPer led to different measurements of the splashback radius to see if this was the case. While a change was observed (see Figure 2), in which larger circles resulted in measuring larger splashback radii, the trend is not yet conclusive. This leaves open the possibility of studying the presence of this systematic in future DES data.
Measuring the splashback radius will continue to be a high priority for DES scientists. Once critical systematics can be controlled, its potential as a probe of both cosmology and astrophysics of galaxy clusters can be realized.
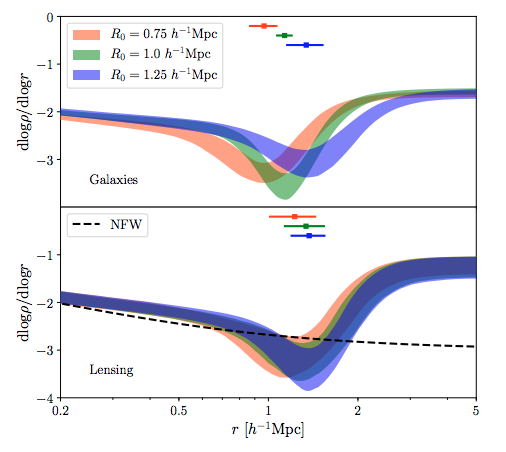
Figure 2: The logarithmic derivative of the modeled 3D profiles. In these figures, the splashback radius corresponds to the minimum of the curves. Top panel: The logarithmic derivative as measured in the galaxy density profiles. Each color corresponds to different sized circles drawn on the sky used when finding clusters. Larger circles (blue) resulted in slightly larger splashback radius compared to the fiducial sized circles (green) and smaller circles (orange). This trend is not statistically conclusive. Lower panel: The logarithmic derivative from the lensing profiles, with an example profile that does not include splashback as the dotted line.

DArchive Author: Tom McClintock
Tom is a postdoc at Brookhaven National Lab. His main focus is on galaxy clusters in DES and using them for cosmology. Some of his projects include measuring galaxy cluster masses using weak lensing, and building cool tools from simulations called “emulators”. You can learn more about his work here: tmcclintock.github.io.
DArchive Editor: Ross Cawthon
Ross is a postdoctoral researcher at the University of Wisconsin-Madison. He works on various projects studying the large-scale structure of the Universe using the millions of galaxies DES observes. These projects include galaxy clustering, correlations of structure with the cosmic microwave background and using the structure of the Universe to infer the redshifts of galaxies. Ross also co-coordinates Education and Public Outreach efforts in DES, including managing the darchives and social media.

Paper Author: Chihway Chang
Chihway co-led the analysis: The splashback feature around DES galaxy clusters: galaxy density and weak lensing profiles.” She is an assistant professor in the Astronomy and Astrophysics Department at the University of Chicago and the Kavli Institute of Cosmological Physics (KICP). She moved about 20 meters from her previous position as a KICP Fellow Oct 2018. Before that, she was a postdoc at ETH Zurich and did her PhD at Stanford University. Chihway is an observational cosmologist that uses large datasets from galaxy and CMB surveys to investigate cosmological and astrophysical questions. Most of her work centers around the theme of weak gravitational lensing, where the shapes of millions of galaxies statistically inform us about the content and the history of the Universe.

Paper Author: Eric Baxter
Eric co-led the analysis: The splashback feature around DES galaxy clusters: galaxy density and weak lensing profiles.” He is a postdoctoral researcher at the University of Pennsylvania. He is interested in using gravitational lensing to study the mass distribution of the Universe at both large and small scales. When not working, he pursues his dream of a competitive ping pong career.