This Darchive describes one of the methods used by DES to estimate galaxy redshifts for cosmological studies. It is based on this paper: https://arxiv.org/pdf/2012.12826.pdf .
In the field of dark matter and dark energy research, accurately determining the distance to galaxies is essential for understanding the universe’s composition and expansion. The distribution of galaxies helps scientists map the presence and behavior of dark matter. Precise distance measurements also help us the study of the effects of dark energy. The primary method of measuring a star or galaxy’s distance away from us is by measuring its redshift. A consequence of the Doppler Effect, redshift is the phenomenon where light from distant objects, such as stars or galaxies, is stretched to longer wavelengths when those objects are traveling away from us. Since our universe is expanding, galaxies which are further away will be traveling faster, which results in the light emitted by these galaxies experiencing a greater redshift compared to closer galaxies.
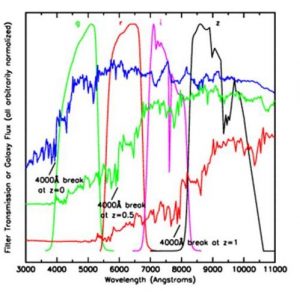
Figure 1: This figure shows the spectroscopic data of three galaxies with redshifts at varying levels, indicated by the blue, green, and red lines. The levels of redshift can be seen by the shift into longer wavelengths when comparing the blue line to the green or red line. 4 of the 5 color bands used for photometry can be seen in the green, red, pink, and black peaked lines. For example, all of the wavelengths in the g-band will add up to just one number, instead of the detailed information seen in the full spectra.
The most accurate way to measure a galaxy’s redshift is using spectroscopy (see Figure 1). Since every element emits a unique light spectrum, we can accurately determine how redshifted a galaxy is by comparing its spectroscopic data to an expected spectrum of a galaxy, which primarily consists of hydrogen and helium. One issue however is that large imaging surveys, such as DES, tend to not have spectroscopic capabilities, as the method to obtain spectroscopic information makes it difficult to gather the spectra of many sources at once. Due to this limitation, the majority of our galaxy data is obtained in “photometric” form, which collects data on the intensity and distribution of light with different color filters. This method can be more easily used for large amounts of galaxies, yet cannot give us the precise spectrum, which means we cannot easily get the redshifts from photometry.
This limitation requires us to find other methods to estimate redshifts. Methods to estimate precise redshifts from a handful of color-filter measurements have been attempted, yet even the best photometric estimates still contain uncertainties in results that are orders of magnitude higher than typical spectroscopic redshift errors.
One alternative method to estimate redshifts of galaxies is called “clustering redshifts”. This method focuses on the clustering of galaxies, which is where galaxies, when separated by relatively small cosmic distances, cluster together over time due to gravity. We can obtain the clustering data of groups of galaxies by measuring the number of galaxies within a certain angular range, which is then compared to a randomly distributed sample of points to determine how significant the clustering is. We can compare the clustering amount between galaxy samples with known (spectroscopic) redshifts, which act as a reference sample, and galaxy samples with unknown redshifts by taking a cross-correlation of the two. This will give us the redshift distribution, which is how many galaxies fall in each specific redshift, for our unknown galaxy sample (see Figure 2). While this method cannot give us significant information on individual galaxies, it can allow us to accurately estimate the redshift distribution of large groups of galaxies at once.
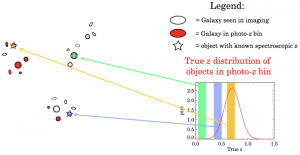
Figure 2: This figure demonstrates the clustering redshift method. The stars represent objects (typically galaxies) where we know the spectroscopic redshift (spec-z). A sample of DES galaxies (red circles) has its clustering to each of the spectroscopic galaxies measured. In the figure, a large amount of clustering to the yellow spec-z galaxy, a small amount to the blue spec-z galaxy, and zero amount to the green spec-z galaxy is seen, numerically producing the plot on the right. Image credit: LSST Science Book.
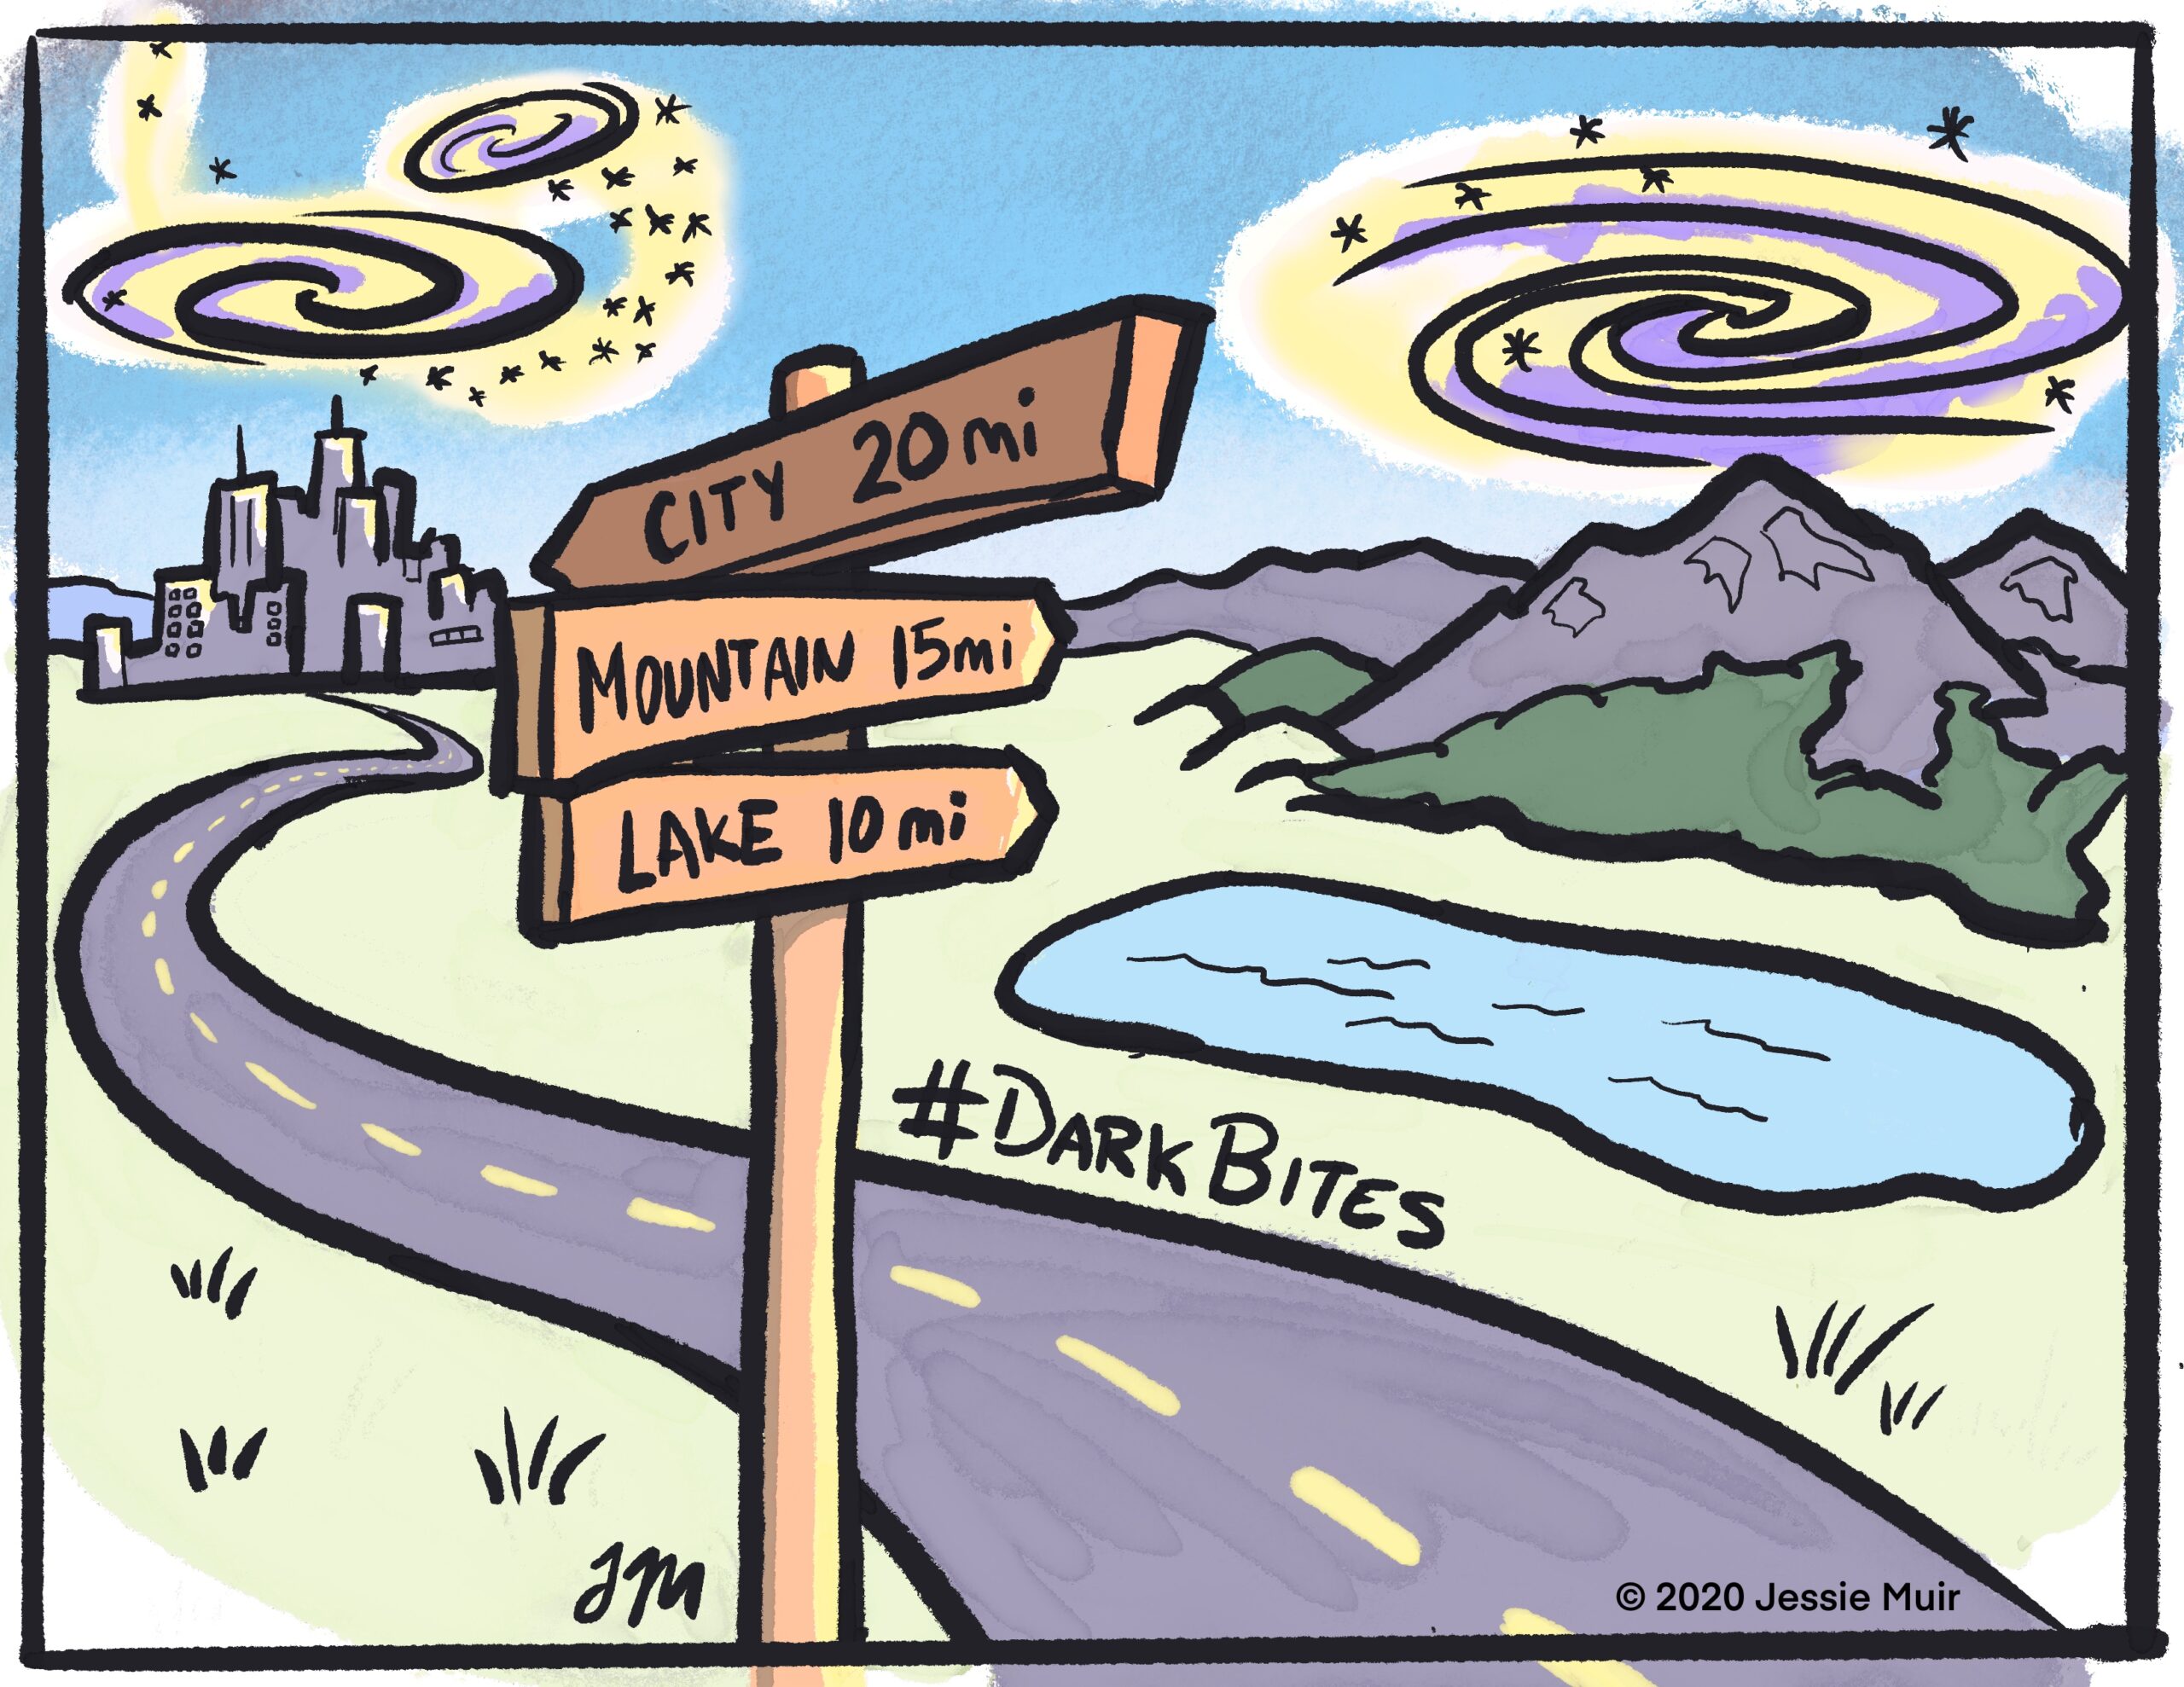
Figure 3: The clustering redshift method can be compared to estimating someone’s distance away from you using nearby landmarks. In our case, the landmarks are spectroscopic galaxies, from which we can estimate the distance of nearby clustered galaxies. Image credit: Jessie Muir ( jessiemuir.com)
In its year-3 cosmology analysis, DES utilized spectroscopic samples from the BOSS and eBOSS galaxy catalogs to produce a measurement of the redshift distributions for the large samples of DES photometric galaxies. In many cases, the resulting shape of the redshift distribution agreed well with the photometric estimated distribution (see Figure 4). In other cases, the clustering method indicated likely biases in the photometric method, which needed to be accounted for in the year-3 cosmology analyses. The results showcase the importance of having a secondary method like clustering in determining the redshift distributions of galaxies.
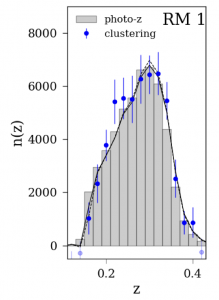
Figure 4: This is one of many redshift distributions measured by DES which shows the clustering redshift method in blue, and the more traditional photometric method in grey. This sample of galaxies is called the ‘redmagic’ (RM) sample.
DArchive Author: Jonathan Fang
Jonathan is an undergraduate music and physics major at William Jewell College, in Liberty, Missouri, and is interested in astrophysics. In the summer of 2023, he worked on a clustering redshifts project with DES. Outside of physics, Jonathan enjoys playing the piano, hiking, and computer animation.
DArchive Editor and Paper Author: Ross Cawthon
 Ross is the author of the paper featured, and the editor of this darchive. He is a professor at William Jewell College in Liberty, Missouri. He works on various projects studying the large-scale structure of the Universe using the millions of galaxies DES observes. These projects include galaxy clustering, correlations of structure with the cosmic microwave background and using the structure of the Universe to infer the redshifts of galaxies. Ross also coordinates Education and Public Outreach efforts in DES, including managing the darchives and social media.