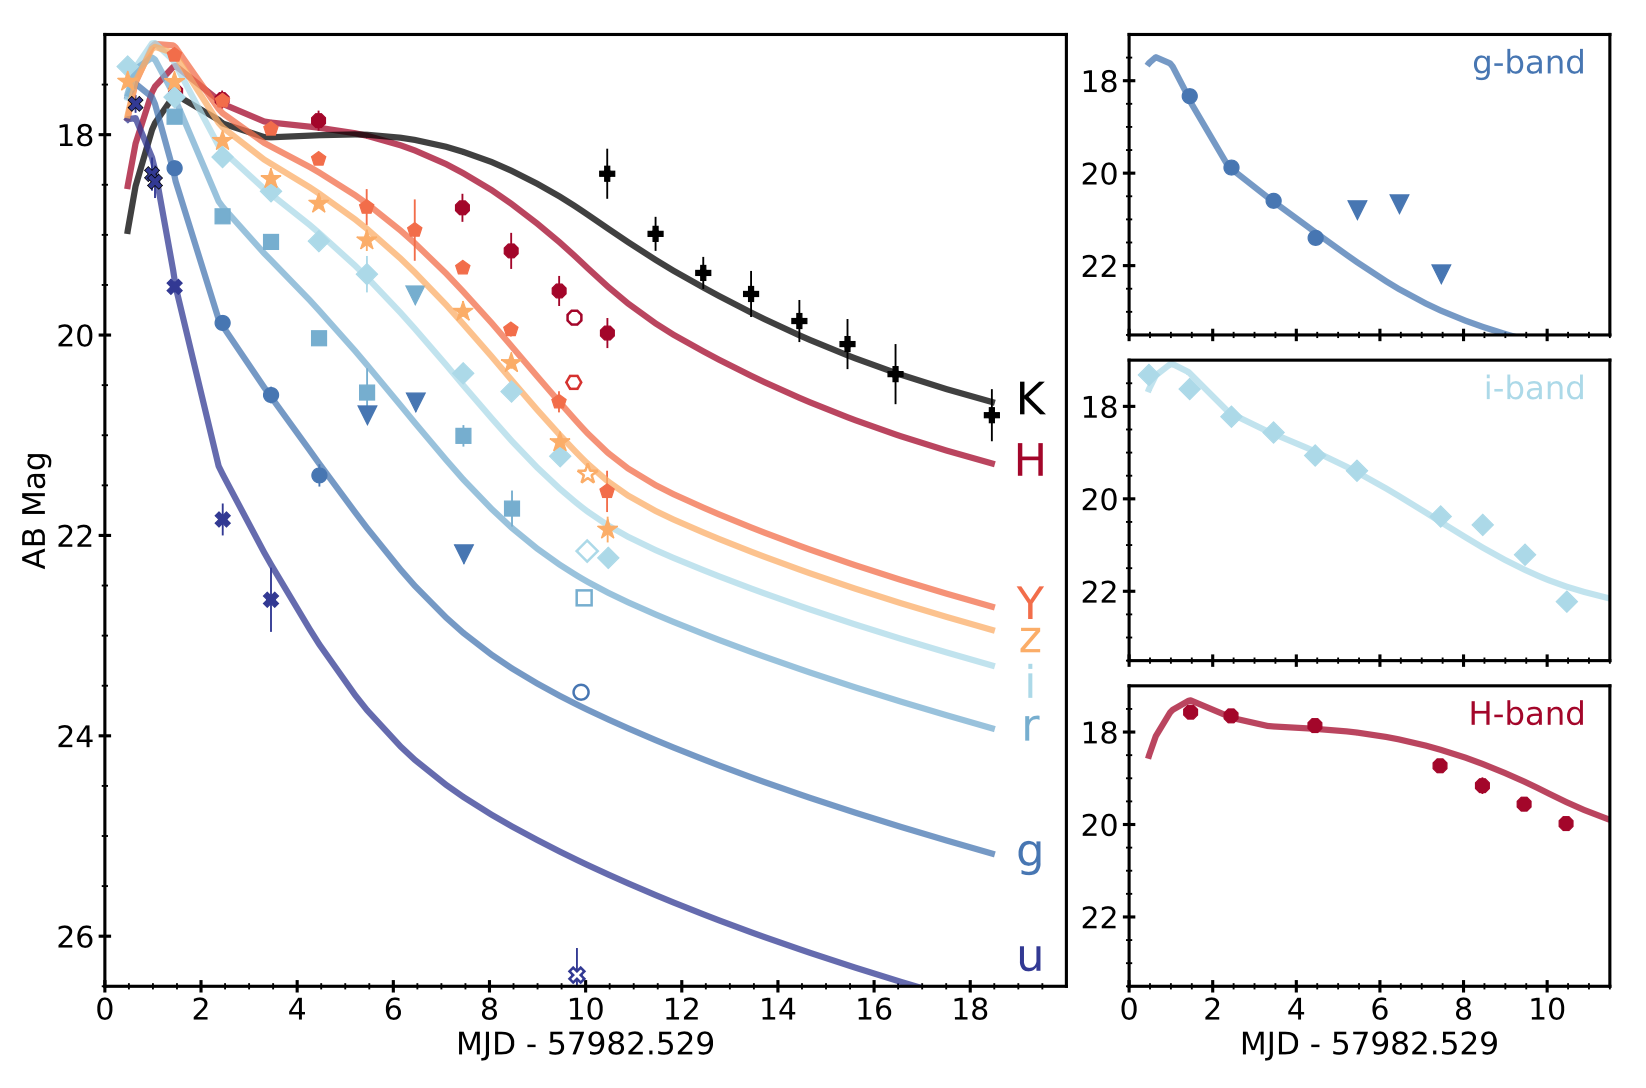
UV, optical, and NIR Light curves of the counterpart of GW170817. The two-component model for r-process heating and opacities (Section 4) is shown as solid lines. Triangles represent 3σ upper limits. Error bars are given at the 1σ level.
UV, optical, and NIR Light curves of the counterpart of GW170817. The two-component model for r-process heating and opacities (Section 4) is shown as solid lines. Triangles represent 3σ upper limits. Error bars are given at the 1σ level.