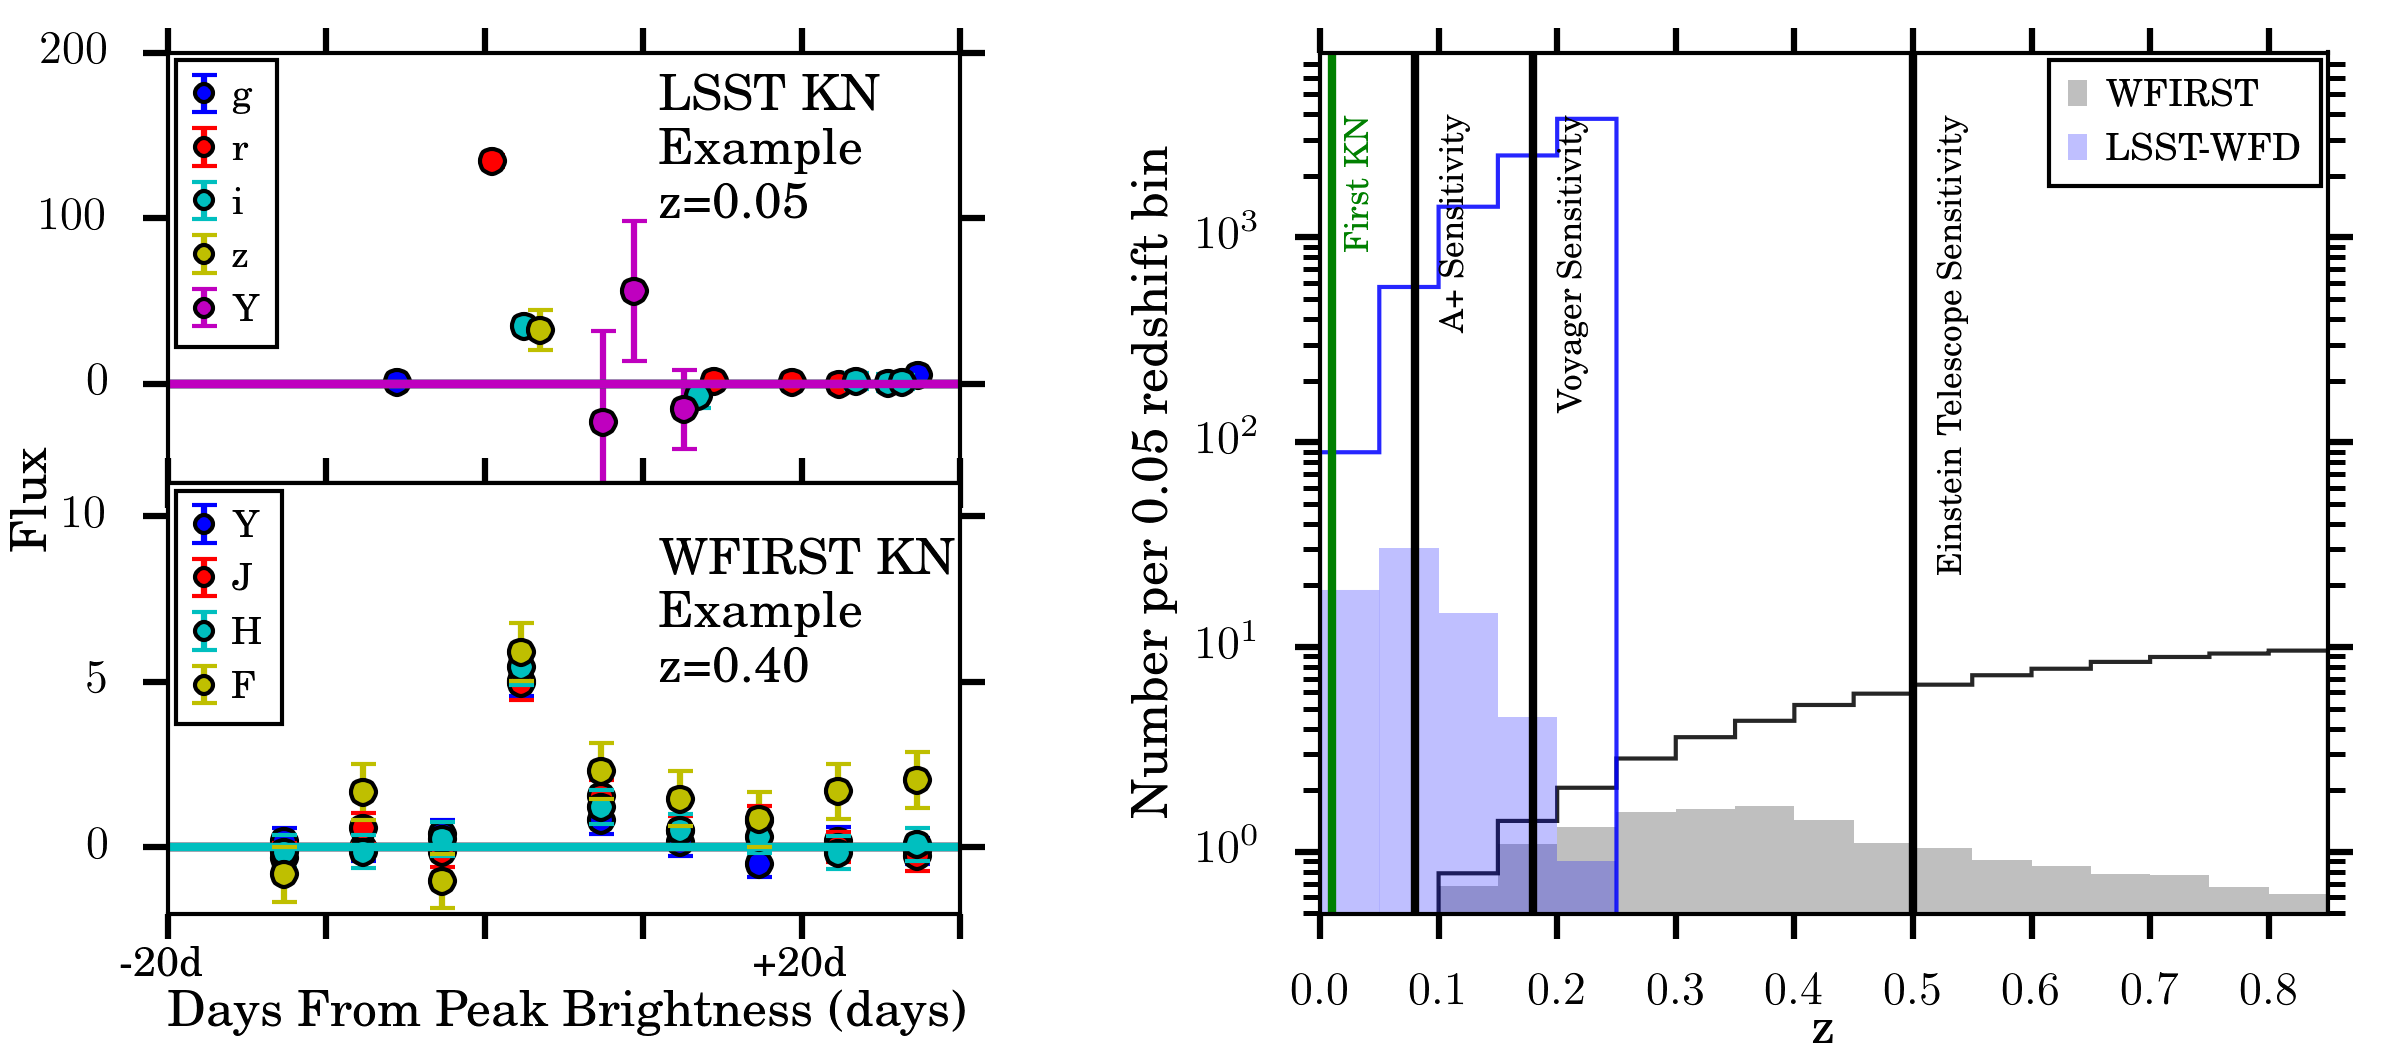
(Left) Example simulated KN light-curves from LSST and WFIRST that pass our selection requirements. The vertical axis flux unit is defined such that mag = 27.5 − 2.5 log(F lux). (Right) KN redshift distributions for all events in the survey footprint (solid histogram) and for events passing selection requirements (shaded histogram). Green vertical line shows the KN redshift (z = 0.0098), and black vertical lines show the sensitivity of future GW experiments.