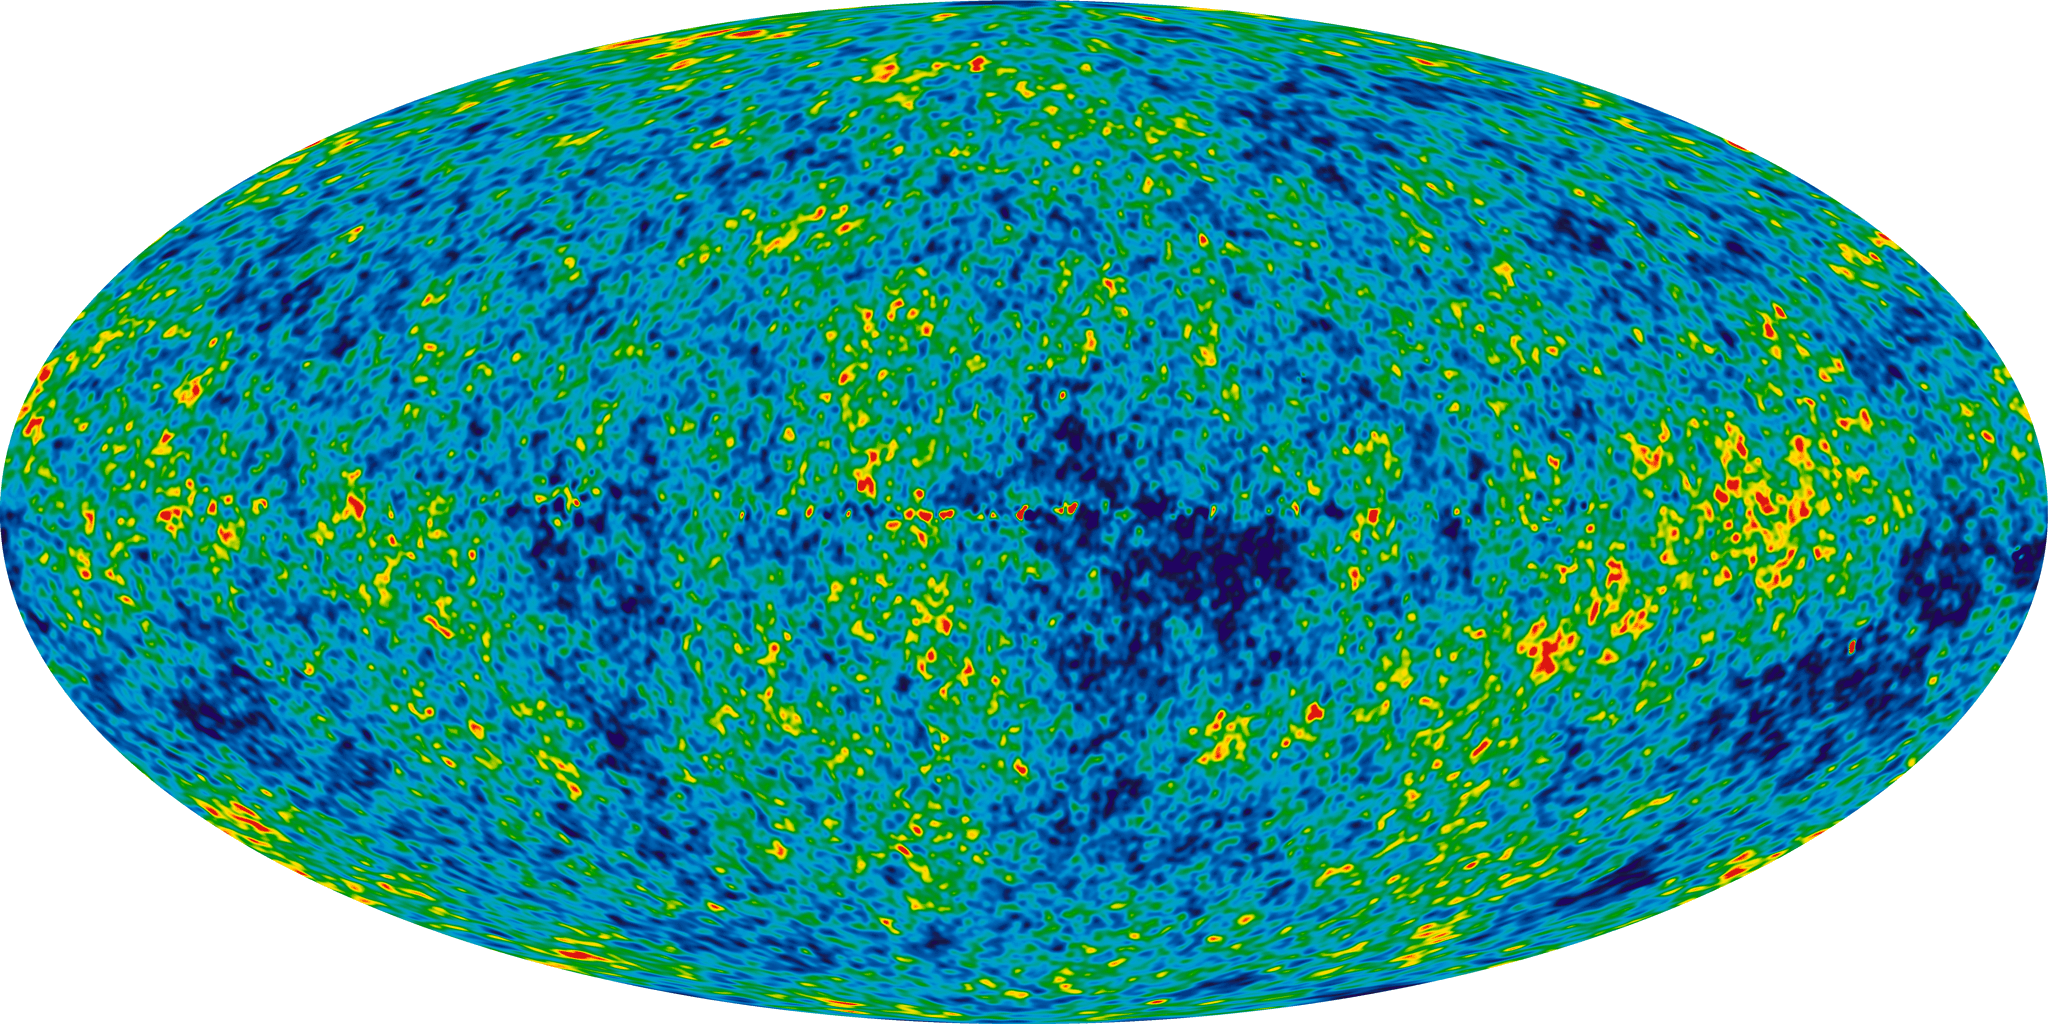
The Cosmic Microwave Background temperature fluctuations from the 7-year Wilkinson Microwave Anisotropy Probe (WMAP) data seen over the full sky. The colors represent extremely tiny temperature fluctuations. Red regions are warmer and blue regions are colder by about 0.0002 degrees. The colder regions show areas that were originally slightly less dense than average, while the warmer regions show areas that were slightly more dense. (Credit: NASA/WMAP Science Team)