Webinar from Jan 22, 2026: DES Y6 3x2pt results webinar – January 22, 2026
Our Year 6 cosmology analysis of galaxy clustering and gravitational lensing is a massive effort from more than one hundred scientists. There will be more than 20 interconnected papers in all, with the main cosmology analysis, and an ‘extended models’ analysis, at the bottom of the page. We provide links to papers that are public.
Key paper: 3×2 cosmology result arXiv: arXiv:2601.14559
Dark Energy Survey Year 6 Results: Photometric Dataset for Cosmology
Authors: K. Bechtol (kbechtol@wisc.edu), I. Sevilla-Noarbe (ignacio.sevilla@ciemat.es), A. Drlica-Wagner (kadrlica@fnal.gov) et al.
Link to paper: https://arxiv.org/abs/2501.05739
Link to Y6 Cosmology data products: https://des.ncsa.illinois.edu/releases/y6a2
DES Y6 Gold is a curated dataset derived from DES Data Release 2 (DR2) that incorporates improved measurement, photometric calibration, object classification, and value-added information. Y6 Gold comprises nearly 5000 deg2 of grizY imaging in the south Galactic cap and includes 669 million objects with a depth of iAB∼23.4 mag at S/N ∼10 for extended objects and a top-of-the-atmosphere photometric uniformity <2 mmag. This catalog is the starting point of many of the cosmology and astronomy papers that use the DES Y6 dataset.
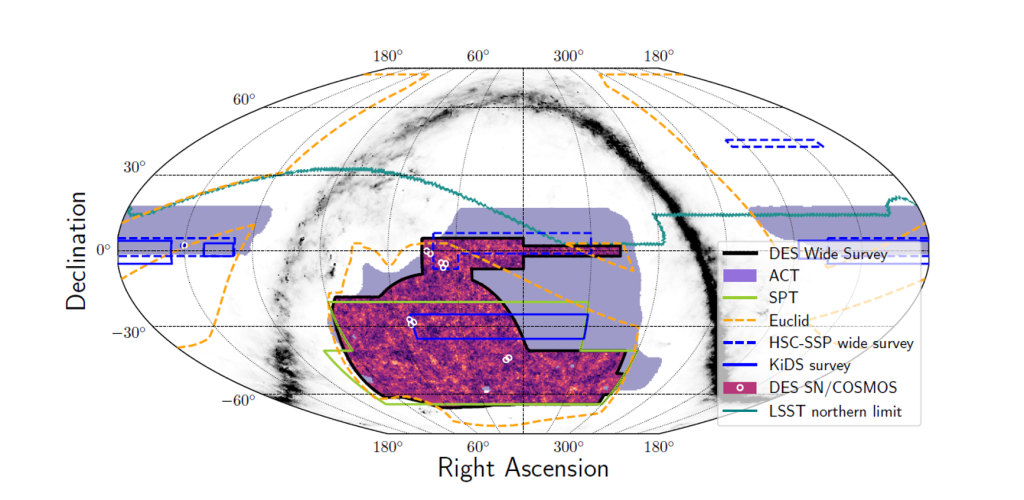
Figure: The final DES wide-area footprint covers ~5,000 deg2 of the southern sky (nearly 1/8th of the full sky). This figure shows the DES wide-area survey footprint as a black outline containing the density of galaxies shown in the purple-orange color map. The DES supernova field locations are shown as white circles. The footprints of several other current and near-future cosmology surveys are shown with colored lines for reference.
Dark Energy Survey Year 6 Results: Point-spread Function Modeling
Authors: T. Schutt (schutt20@stanford.edu) et al.
Link to paper: https://arxiv.org/abs/2501.05781
We present the point-spread function (PSF) modeling for weak lensing shear measurement using the full six years of the Dark Energy Survey (DES Y6) data. We review the PSF estimation procedure using the PIFF (PSFs In the Full FOV) software package and describe the key improvements made to PIFF and modeling diagnostics since the DES year three (Y3) analysis: (i) use of external Gaia and near-infrared photometry catalogs to ensure higher purity of the stellar sample used for model fitting, (ii) addition of color-dependent PSF modeling, the first for any weak lensing analysis, and (iii) inclusion of model diagnostics inspecting fourth-order moments, which can bias weak lensing measurements to a similar degree as second-order modeling errors. In particular, adding color dependence significantly improves modeling errors for g-band exposures such that the Y6 weak lensing analysis uses riz-band shape data and griz-band photometry data (as opposed to riz only for Y3), providing a fourth band for the source sample photometric redshift estimation.
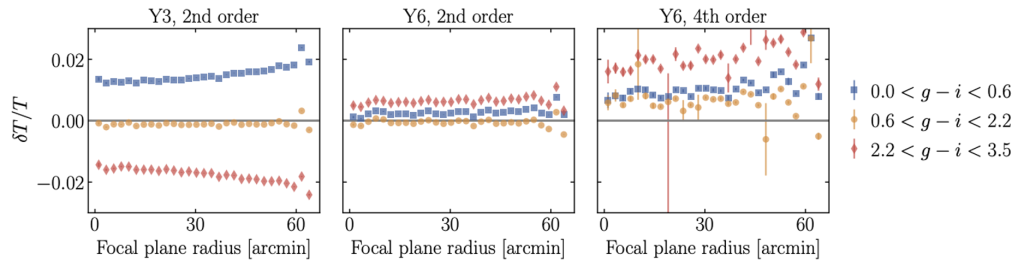
Figure: PSF fractional size residuals (dT/T) in g-band exposures, binned as a function of radial position in the focal plane. Stars are split into three groups in 𝑔 − 𝑖 color to study color dependence of the residuals: the bluest 25% (blue squares), middle 50% (yellow circles) and reddest 25% (red diamonds) among stars detected in 𝑔 band. The Y3 second-order size residuals (left) show a mean offset (due to chromatic seeing) and large-scale radially-dependent trend (due to optical chromatic aberrations). These effects are largely removed in the Y6 second-order (middle) and fourth-order residuals (right), though smaller nonlinear trends remain.
Dark Energy Survey Year 6 Results: Synthetic-source Injection Across the Full Survey Using Balrog
Authors: D. Anbajagane (dhayaa@uchicago.edu), M. Tabbutt, J. Beas-Gonzalez, B. Yanny et al.
Link to paper: https://arxiv.org/abs/2501.05683
Balrog is the synthetic source injection (SSI) framework used to directly translate true properties (fluxes, sizes) to measured quantities in the Dark Energy Survey’s (DES) Year 6 (Y6) dataset. We systematically inject 3 million realistic galaxy models, derived from DES Deep Field observations, into every image across every part of the DES footprint, amounting to 146 million injections across 5000 deg2. These augmented images are passed through the same processing pipeline as the data and inherit all measurement systematics. The resulting catalog is a Monte Carlo sampling of the DES transfer function and is used as a powerful diagnostic and calibration tool for a variety of DES Y6 science, particularly for the calibration of the photometric redshifts of galaxies (see Yin et al. and Giannini et al.) and magnification biases (see Legnani et al.)
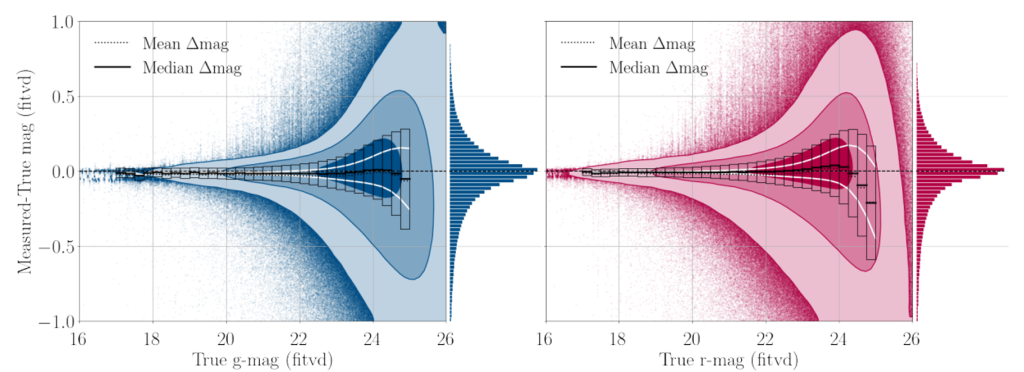
Figure: This figure shows residuals between the true and measured fluxes of the 3 million objects injected in Balrog, with contours showing the 68/95/99.7% regions. It highlights the non-Gaussian nature of this mapping, including the presence of a sparse tail of outliers caused by image processing systematics (masking, blending, background subtraction, etc.). The entire complexity of this mapping is fully accounted for in our estimates of redshifts and magnification in Y6.
Dark Energy Survey Year 6 Results: Improved Mitigation of Spatially Varying Observational Systematics with Masking
Authors: M. Rodríguez-Monroy (martin.rodriguez@inv.uam.es), N. Weaverdyck (nweaverdyck@lbl.gov) et al.
Link to paper: https://arxiv.org/abs/2509.07943
We present the definition of the DES Y6 angular footprint. This footprint is built upon a seed footprint to which we apply different cuts to remove problematic regions in our images. One particularity of this footprint is that we remove from it outliers and extreme values from different template maps of contamination, such as seeing or stellar density. This has enabled the upgrading of one of our observational systematics decontamination methods, ISD, allowing us to better identify and correct for contaminants that, if untreated, could bias the cosmological results obtained. The DES Y6 joint footprint has been designed to be used in all DES Y6 analyses, from galaxy clustering to 3x2pt, which also facilitates the combination of probes and the computation of covariances. The final area covered by this footprint is 4031.04 deg².
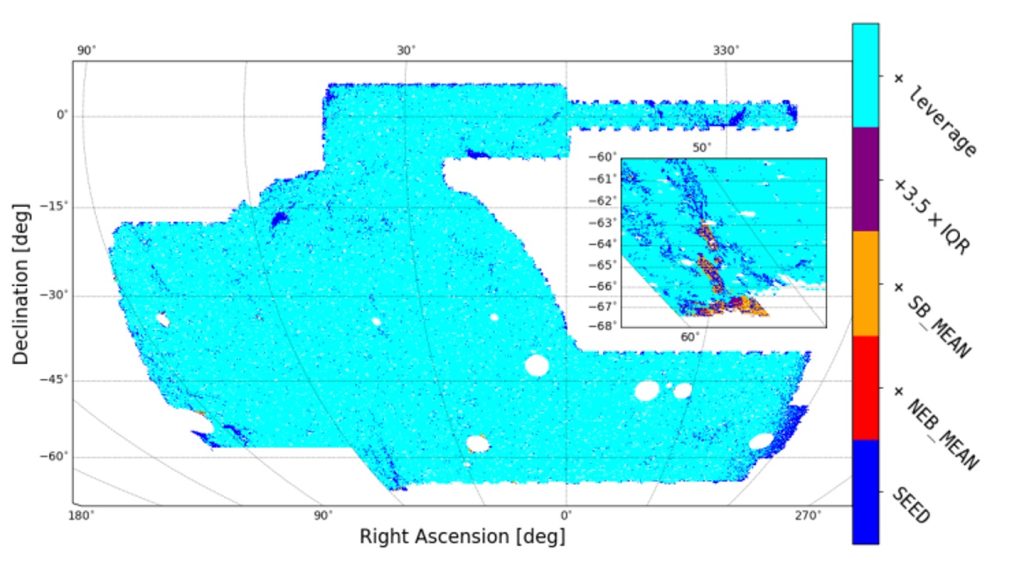
Figure: Evolution of the footprint from the seed one as we apply cuts corresponding to the extreme values of our template maps of contamination.
Dark Energy Survey Year 6 Results: Cell-based Coadds and Metadetection Weak Lensing Shape Catalogue
Authors: M. Yamamoto (masaya.yamamoto@princeton.edu), M. R. Becker et al.
Link to paper: https://arxiv.org/abs/2501.05665 (MNRAS: https://academic.oup.com/mnras/article/543/4/4156/8268899 )
We present the Metadetection weak lensing galaxy shape catalogue from the six-year Dark Energy Survey (DES Y6) imaging data. We describe how the catalogue was constructed, including the two new major processing steps, cell-based image coaddition, and shear measurements with metadetection. The DES Y6 Metadetection weak lensing shape catalogue consists of 151,922,791 galaxies detected over griz bands, with an effective number density of = 8.22 galaxies per arcmin and shape noise of 0.29. We carry out a suite of validation tests on the catalogue, including testing for point spread function (PSF) leakage, testing for the impact of PSF modelling errors, and testing the correlation of the shear measurements with galaxy, PSF, and survey properties. In addition to demonstrating that our catalogue is robust for weak lensing science, we use the DES Y6 image simulation suite to estimate the overall multiplicative shear bias of our shear measurement pipeline. We find no detectable multiplicative bias at the roughly half-per cent level, with m = (3.4 +- 6.1) x 10^-3, at 3sigma uncertainty. This is the first time both cell-based coaddition and Metadetection algorithms are applied to observational data, paving the way to the Stage-IV weak lensing surveys.
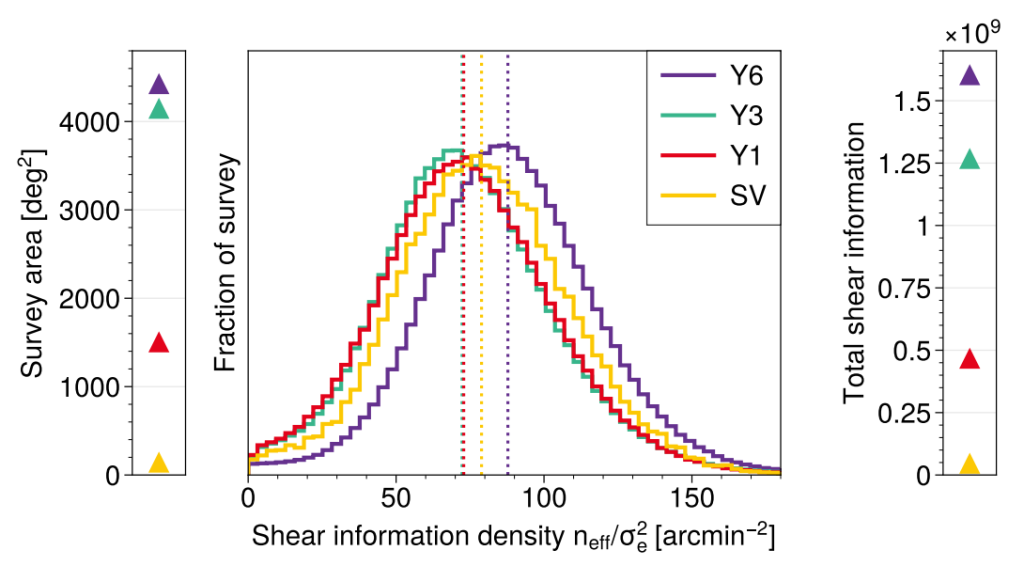
Figure: A histogram showing the shear information density (the ratio of number density and shape noise^2) in HEALPix pixels (nside=1024) for the DES Y6 Metadetection catalogue footprint, compared with the same quantity from several catalogue releases from the Dark Energy Survey – Science Verification (SV, Jarvis et al. 2016), Year 1 (Y1, Zuntz, Sheldon et al. 2018), Year 3 (Y3, Gatti, Sheldon et al. 2021). Each histogram has the same area under the curve, and the median of each histogram is shown as the dotted line for each release. The histogram is accompanied by the panels showing the survey area (left) and the total shear information content of the catalogue (right), which is the sum of pixel areas for each survey times the shear information density. We can see that as the DES survey has progressed, the data set has become more uniform and its total information content has increased substantially.
Dark Energy Survey Year 6 Results: MagLim++ Lens Sample Selection and Measurements of Galaxy Clustering
Authors: N. Weaverdyck (nweaverdyck@lbl.gov), M. Rodríguez-Monroy (martin.rodriguez@inv.uam.es) et al.
Link to paper: arXiv:2601.14484
The MagLim++ lens galaxies are used to measure the galaxy clustering and (in combination with the source galaxies) galaxy-galaxy lensing observables. We describe the selection of this sample, including novel cuts developed to identify and remove residual contamination, mostly from stars and QSOs. We develop improved approaches to identify and mitigate the impact of local observing conditions, which can manifest as spurious density fluctuations and bias cosmological results. We measure the two-point angular galaxy clustering of the resultant MagLim++ catalog, which has over 9 million galaxies distributed across 4,031 square degrees and split into six redshift bins. We demonstrate robustness to a wide range of tests, and using galaxy clustering alone we constrain the matter density of the universe to (Ωm) and the amplitude of galaxy clustering (biσ8) across all six redshift bins.This sample and measurements of galaxy clustering form a key component of the DES Year 6 legacy cosmological analyses.
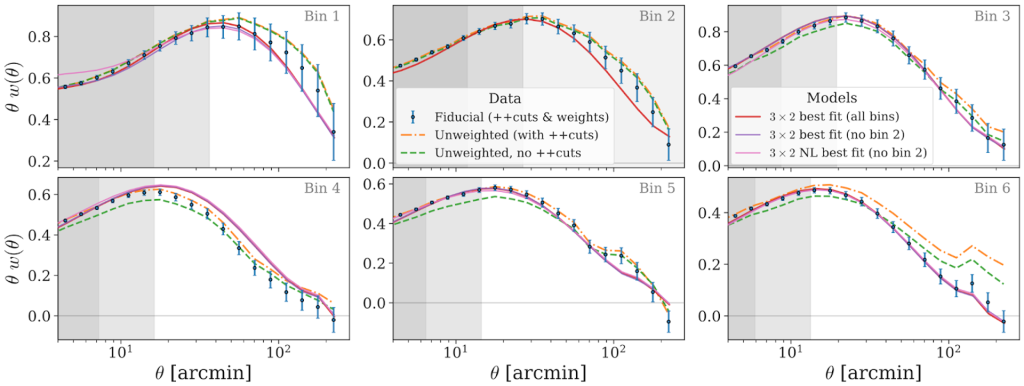
Figure: This figure shows the angular two-point correlation function of MagLim++ galaxies (points), along with the best fit predictions from LCDM under different models and data combinations (solid lines). To show the impact of the new quality cuts implemented in this work, the green dashed curve shows the measurement without these cuts applied, indicating significant contamination, particularly at small scales and in the higher redshift bins. The orange curve shows how the signal is sharpened after applying these cuts, removing the residual stellar contamination, with further significant shifts coming from correcting for the impact of local observing conditions (blue points and error bars).
Dark Energy Survey Year 6 Results: Redshift Calibration of the Weak Lensing Source Galaxies
Authors: B. Yin (boyan.yin@duke.edu) et al.
Link to paper: https://arxiv.org/abs/2510.23566
We present the methodology, calibrated redshift distributions, and uncertainties of the final Dark Energy Survey Year 6 (Y6) weak lensing galaxy data, divided into four redshift bins centered at <z> = [0.414, 0.538, 0.846, 1.157]. We combine independent information from two methods on the full shape of redshift distributions: optical and near-infrared photometry within an improved Self-Organizing Map p(z) (SOMPZ) framework, and cross-correlations with spectroscopic galaxy clustering measurements (WZ), which we demonstrate to be consistent both in terms of the redshift calibration itself and in terms of resulting cosmological constraints within 0.1σ. We describe the process used to produce an ensemble of redshift distributions that account for several known sources of uncertainty. Among these, imperfection in the calibration sample due to the lack of faint, representative spectra is the dominant factor. The final uncertainty on mean redshift in each bin is σ(<z>) = [0.012, 0.008,0.009, 0.024]. We ensure the robustness of the redshift distributions by leveraging new image simulations and a cross-check with galaxy shape information via the shear ratio (SR) method.
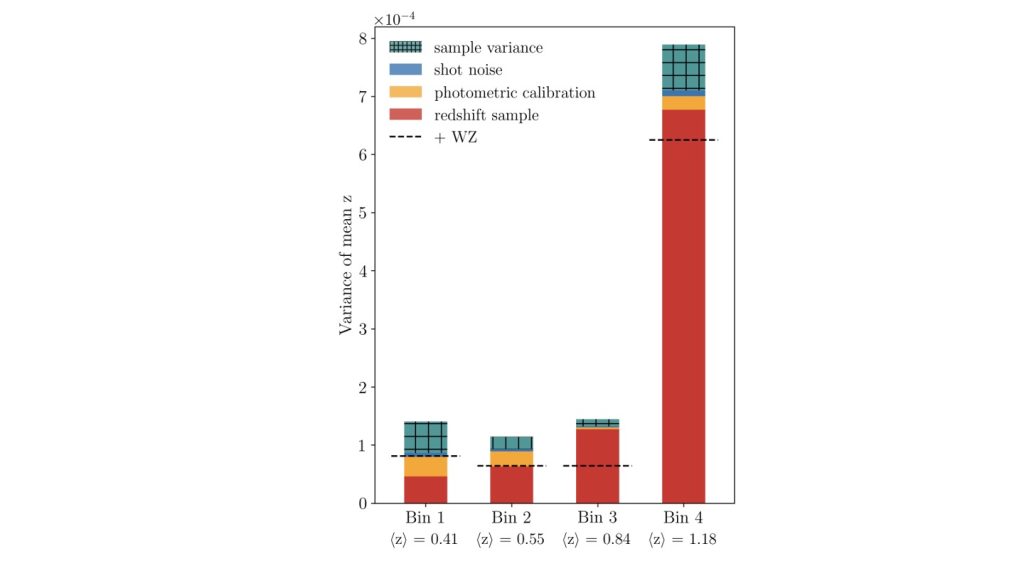
Figure: This figure shows the relative contribution of each source of uncertainty for the four redshift bins. Sample variance and shot noise arise from the limited area and size of our calibration sample, photometric calibration uncertainty stems from the zero-point offsets of the four disjoint deep fields, while redshift sample uncertainty stems from our use of multi-band photometric redshift sample COSMOS and PAUS. The dashed black lines show the constraints on mean redshift after adding clustering information.
Dark Energy Survey Year 6 Results: Redshift Calibration of the MagLim ++ Lens Sample
Authors: G. Giannini (giulia.giannini15@gmail.com) et al.
Link to paper: https://arxiv.org/abs/2509.07964
In this paper we present the derivation and calibration of the redshift distributions for the MagLim++ lens galaxy sample used in the Dark Energy Survey Year 6 (DES Y6) 3×2pt cosmological analysis. We combine independent information from two complementary approaches that constrain the full shape of the redshift distributions: optical and near-infrared photometry within an improved Self-Organizing Map p(z) framework (SOMPZ), and cross-correlations with spectroscopic galaxy samples through clustering-redshift measurements (WZ). The resulting calibration achieves typical uncertainties on the mean redshift at the 1–2% level, corresponding to an average reduction of 20–30% compared to DES Y3. Through a new approach to compress the n(z) uncertainties into a small set of orthogonal modes, which can be efficiently marginalized over on cosmological constraints, we perform a suite of robustness tests to validate the full methodology. Overall, this work establishes the MagLim++ sample as a well-characterized lens sample for precision cosmology with DES Y6, and demonstrates a redshift-calibration framework that is readily scalable to future large photometric surveys.
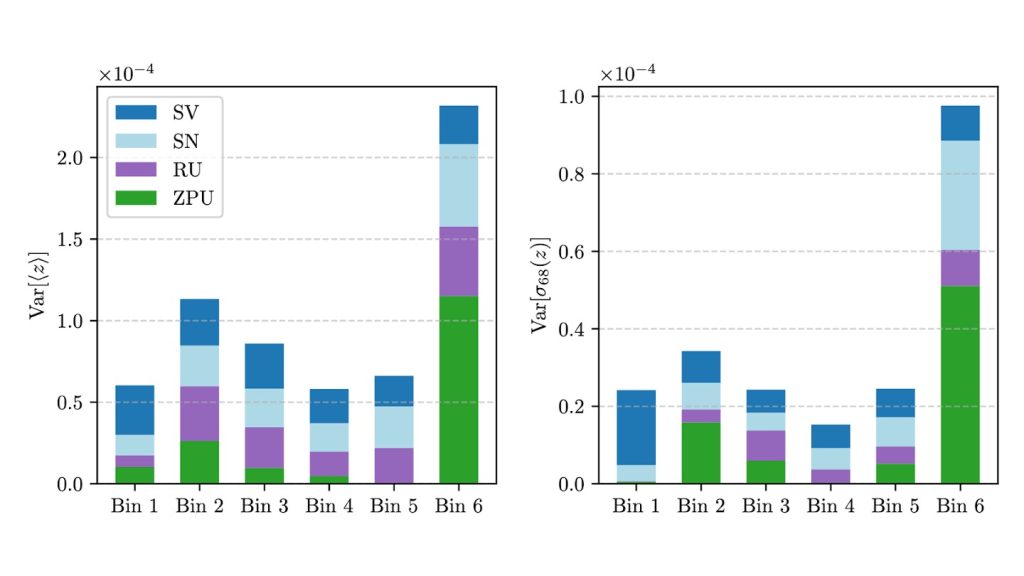
Figure: The relative contribution of each source of uncertainty for the mean (left) and the width (right) for each of the six tomographic bins. We show the individual contributions from sample variance (SV, blue), shot noise (SN, light blue), redshift sample uncertainty (RU, purple), and photometric zeropoint uncertainty (ZPU, green). No single source dominates all bins or metrics, underscoring the need to propagate all uncertainty components when modeling 𝑛(𝑧). In bin 6, where the redshift distribution is broader and more sensitive to magnitude-dependent shifts, ZPU drives a particularly large uncertainty on the width. The magnitude of the effect varies by source and bin, and in some cases only the mean or only the width shows a significant increase (e.g., > 10%). This reflects the non-linear nature of uncertainty propagation at the SOM 𝑛(𝑧) level, which impacts the full distribution shape, with the mean and width being affected only indirectly as derived quantities.
Dark Energy Survey Year 6 Results: Clustering-redshifts and Importance Sampling of Self-Organised-Maps 𝑛(𝑧) Realizations for 3 × 2pt Samples
Authors: W. d’Assignies (wdoumerg@ifae.es), G. M. Bernstein, B. Yin, G. Giannini, A. Alarcon, M. Manera et al.
Link to paper: https://arxiv.org/abs/2510.23565
In this work, to overcome limitations from color–redshift degeneracies and incomplete spectroscopic coverage, we enhance the SOMPZ approach by incorporating clustering-based redshift constraints (clustering-z, or WZ) from angular cross-correlations with BOSS and eBOSS galaxies, and eBOSS quasar samples. We define a WZ likelihood and apply importance sampling to a large ensemble of SOM-derived n(z) realizations, selecting those consistent with the clustering measurements to produce a posterior sample for each lens and source bin. The analysis uses angular scales corresponding to 1.5–5 Mpc to optimize signal-to-noise while mitigating modeling uncertainties, and marginalizes over redshift-dependent galaxy bias and other systematics informed by the N-body simulation Cardinal. While a sparser spectroscopic reference sample limits WZ constraining power at z>1.1, particularly for source bins, we demonstrate that combining SOMPZ with WZ improves redshift accuracy and enhances the overall cosmological constraining power of DES Y6.
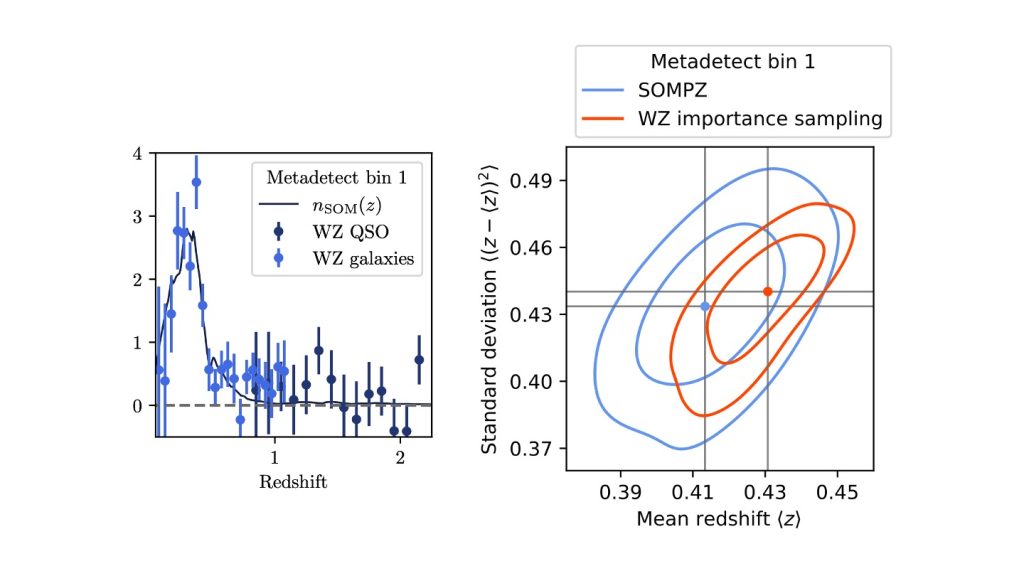
Figure: The figure on the left shows the redshift distribution of the first source bin from SOMPZ (solid line), compared to the WZ-based reconstructions using BOSS/eBOSS galaxies and eBOSS quasars, which provide information up to z=2.2z=2.2. On the right, we show the joint posterior of the mean redshift and width of the same bin, with blue contours corresponding to SOMPZ only and orange contours including the additional WZ information. The inclusion of WZ significantly reduces the uncertainties and induces a small, but consistent, shift toward higher redshift relative to the SOMPZ-only result.
Sampling Bayesian Probabilities Given Only Sampled Priors
Authors: G. M. Bernstein (garyb@physics.upenn.edu), W. d’Assignies, M. A. Troxel, A. Alarcon, A. Amon, G. Giannini, B. Yin et al.
Link to paper: https://arxiv.org/abs/2506.00758
In the DES Y6 analyses, the knowledge of the redshift distributions n(z) of each sample of galaxies is expressed as a set of thousands of samples from a Markov Chain combining photometric and clustering information. It is infeasible to marginalize directly over all of these potential n(z) possibilities, and also infeasible to create a density estimator over the many hundreds of dimensions of freedom of the n(z)’s. This paper describes a linear compression technique that reduces the dimensionality of the n(z) immensely while preserving all information that has measurable effect on the 3x2pt observables, and shows how to create an accurate density estimator over the compressed space. The cosmological Markov Chains can then sample the n(z) functions as a continuous function of a small number of free parameters. The technique is generally applicable to high-dimensional nuisance parameters with priors derived from samplers.
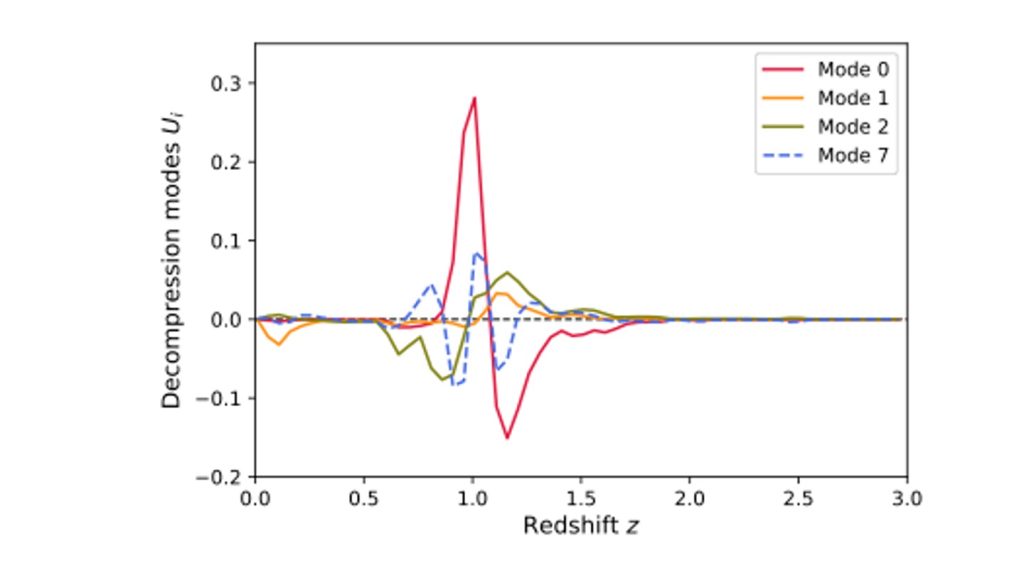
Figure: This figure shows the redshift dependence of the three modes (0,1,2) of variation of n(z) of one of the lens galaxy bins that can measurably alter the 3×2 observables. Mode 7 is an example of a form of variation that exists in the n(z) samples but does not alter the 3×2 observables measurably, and can hence be ignored in the cosmology inference.
Dark Energy Survey Year 6 Results: Image Simulations for Weak Lensing Shear and Photometric Redshift Calibration
Authors: S. Mau (sidney.mau@duke.edu), M. R. Becker, et al.
Link to paper: TBD (in prep.)
We describe the calibration of the shear catalogs for the DES Y6 weak lensing analysis. To capture the full extent of known statistical and systematic uncertainties in the DES Y6 data and methods, we produce an extensive suite of image simulations that model shear tracers in typical DES weak lensing fields and run the same measurement algorithms as used to produce the DES Y6 shear catalog and source redshift distributions. From these data, we infer the multiplicative shear bias and constrain the model parameters for the effective redshift distribution for lensing in each of four tomographic samples for weak lensing for the DES Y6 shear analysis. We also measure correlations between the shear and redshift bias parameters, making explicit the intrinsic degeneracy between these quantities in the presence of blending and motivating the use of a fully covariant bias prior when modeling cosmic shear measurements. The calibration products produced in this work are fit to be used in the final DES Y6 weak lensing analysis and will ensure that the resulting cosmology constraints are unbiased with respect to the statistical and systematic uncertainties associated with shear measurement and blending.
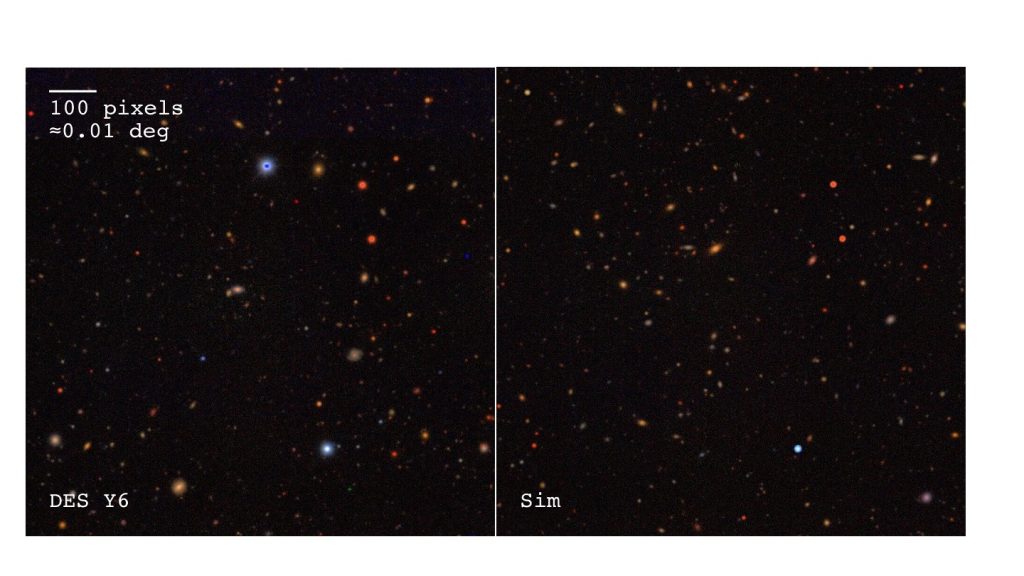
Figure: Comparison between real and simulated multiband, coadd, cutout images of the same region of the sky. The simulations include realistic populations of galaxies and stars informed by external data and both cosmological and Milky Way simulations, respectively, and include pixel-level systematic effects, such as World Coordinate System transforms, point spread functions, background variance, and masks, as characterized from the real data.
Dark Energy Survey: Modeling Strategy for Multiprobe Cluster Cosmology and Validation for the Full Six-Year Dataset
Authors: C. To (chto@uchicago.edu) et al.
Link to paper: https://arxiv.org/pdf/2503.13631
We present and validate a unified model for combining galaxy-cluster abundances with weak-lensing, galaxy-clustering, and cluster-clustering two-point correlations (“CL+3×2pt”) at the accuracy level required for the full DES Year 6 dataset. Our validation uses (1) targeted simulated tests to quantify modeling misspecification impacts and (2) end-to-end tests on DES-Y6–like mock catalogs built from customized Cardinal simulations, including realistic galaxy populations, selection effects, and photometric-redshift systematics. In addition to CL+3x2pt, we also validate that the model is sufficient for several other data combinations: the CL+GC subset of this data vector (excluding galaxy–galaxy lensing and cosmic shear two-point statistics) and the CL+3x2pt+BAO+SN (combination of CL+3x2pt with Y6 DES baryonic acoustic oscillation and Y5 supernovae data). Across a broad suite of systematic checks, the model meets DES-Y6 requirements.
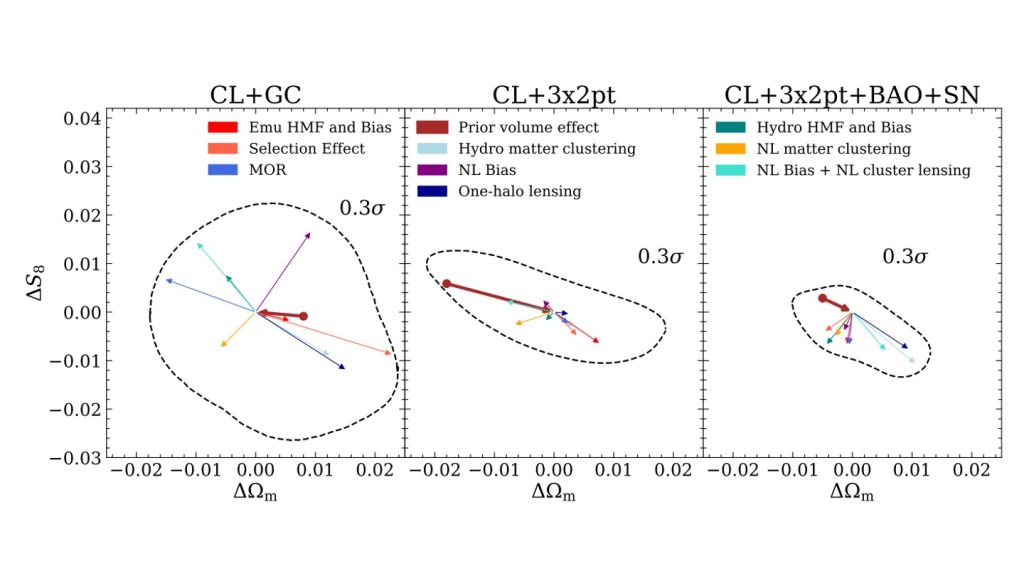
Figure: This figure shows how various systematic contaminations shift the cosmological constraints (arrows) for CL+GC, CL+3×2pt, and CL+3×2pt+BAO+SN relative to the baseline, with the dashed line marking the 0.3σ tolerance and arrow lengths indicating the bias magnitude.
Dark Energy Survey Year 6 Results: Weak Lensing and Galaxy Clustering Cosmological Analysis Framework
Authors: D. Sanchez-Cid (david.sanchezcid@physik.uzh.ch), A. Ferté (ferte@slac.stanford.edu), J. Blazek, et al.
Link to paper: arXiv:2601.14859
This paper presents the methodology for the weak lensing and galaxy clustering analyses of the Dark Energy Survey Year 6 data set. We design and validate robust pipelines for cosmic shear, galaxy clustering combined with galaxy-galaxy lensing (2×2pt), and their joint analysis (3×2pt). We consider both ΛCDM and wCDM, determining prescriptions for treating theoretical systematics, a well-defined set of scales for the analyses of real data, and an analytical estimate of the data covariance. The entire process is carried out using mock data and simulations, allowing us to remain blind to results from the data. We account for the main theoretical systematics on small scales — baryonic feedback, intrinsic alignments, and galaxy bias — providing both linear and nonlinear descriptions for the latter two. Scales where uncertainties from these effects are not well controlled and could bias cosmological constraints are excluded. The methodology presented here forms the basis for the cosmological inference presented in the associated Key Papers and lays the groundwork for future cosmic surveys such as the Vera C. Rubin Observatory Legacy Survey of Space and Time.
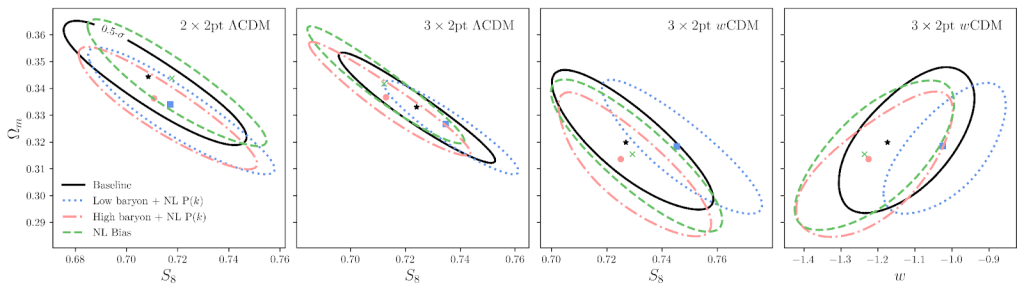
Figure: This figure demonstrates that our analysis pipelines are robust against theoretical uncertainties on small scales. We show 0.5σ confidence contours in the Ωm–S8 and Ωm–w planes for the 2×2pt and 3×2pt analyses under both ΛCDM and wCDM. Each panel compares our baseline analysis (black solid) against signals contaminated with different modeling choices: low and high baryonic feedback scenarios combined with a nonlinear matter power spectrum (blue dotted and red dash-dotted), and nonlinear galaxy bias (green dashed). In all cases, the shifts in cosmological parameters remain below our 0.5σ threshold, validating the scale cuts adopted for the fiducial analyses.
Dark Energy Survey Year 6 Results: Magnification Modeling and its Impact on Galaxy
Clustering and Galaxy-Galaxy Lensing Cosmology
Authors: E. Legnani (elegnani@ifae.es) et al.
Link to paper: arXiv:2601.14833
We quantify the effect of magnification on the MagLim++ lens sample in the DES Y6 galaxy clustering and galaxy-galaxy lensing analyses. We parameterize magnification bias through a coefficient describing the response of the selected galaxy number density to lensing convergence and measure this coefficient for each redshift bin using the Balrog synthetic source injection catalog, which captures the full complexity of the survey selection function. The resulting estimates are more precise and accurate than those from DES Year 3 due to increased Balrog area and improved reweighting to match the data. We validate the robustness of the cosmological constraints against variations in magnification priors and the inclusion of clustering cross-correlations. In contrast, neglecting magnification induces systematic shifts in cosmological parameters at the 1sigma level, consistent with simulated analyses, demonstrating that it must be modeled to avoid biased inferences.
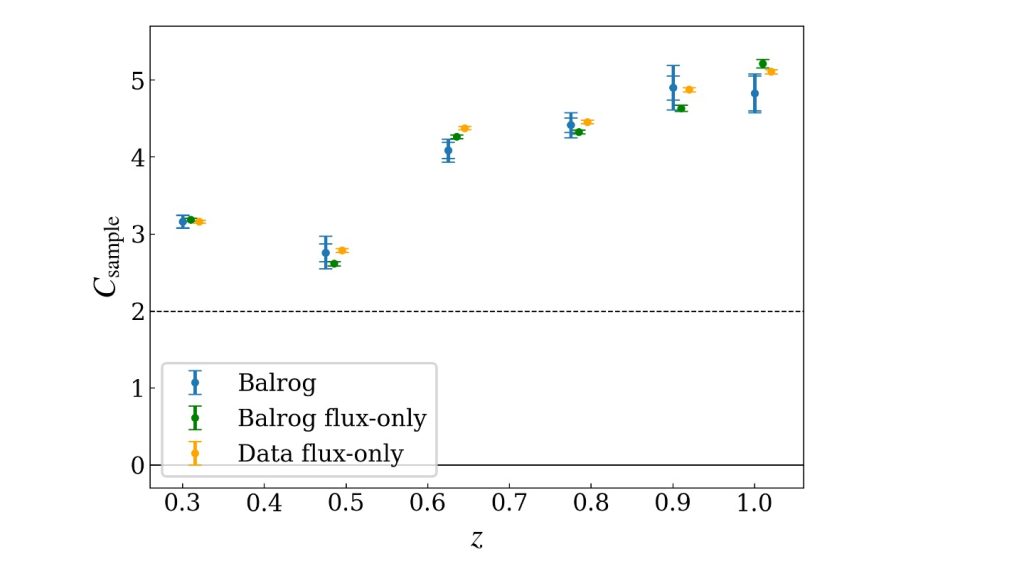
Figure: Magnification coefficient estimates for the six redshift bins of MagLim++. Fiducial values derived from Balrog are shown in blue, while approximate flux-only estimates from Balrog and real data are shown in green and yellow, respectively. The solid line indicates zero magnification bias from sample selection, and the dashed line indicates zero total magnification bias.
Dark Energy Survey Year 6 Results: Fast and Interpretable Posterior Predictive Checks for Correlated Cosmic Probes
Authors: C. Doux (doux@lpsc.in2p3.fr), J. Muir (muirjc@ucmail.uc.edu) et al.
Link to paper: TBD (in prep.)
This paper introduces and validates the new approach to using posterior predictive distributions (PPD) to test the internal consistency of measurements which is used as a pre-unblinding check in our DES y6 3x2pt analysis. A PPD is a probability distribution defined in the space of observables (two-point correlation measurements), obtained by convolving the posterior distribution in parameter space with the likelihood. It provides a way of assessing the goodness of fit of a set of measurements, or the agreement between sets of disjoint measurements, given the assumptions of a model. We introduce an efficient and numerically stable method for approximating the 3x2pt PPD using a Gaussian mixture model, as well as a consistency metric which compresses that high dimensional distribution into an interpretable number. We also present tests of its performance on a toy model, DES Y3 data, and noisy simulated realizations of DES Y6 3x2pt analyses.
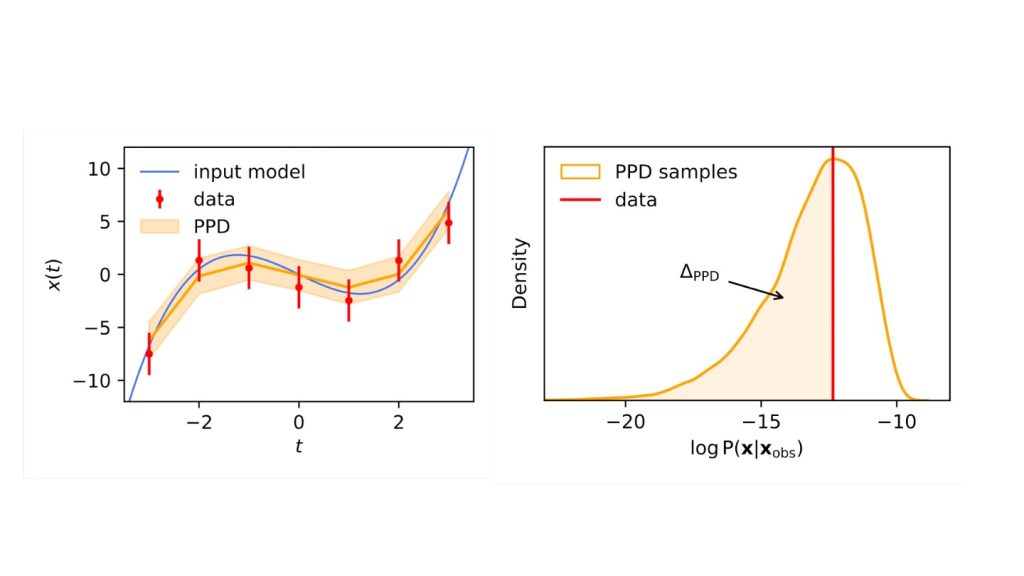
Figure: This Figure shows results from a toy model demonstration of our PPD method and metric for assessing the data’s internal consistency. The image on the left shows synthetic data in red generated from a true underlying model in in blue, with the resulting PPD in orange. The image on the right shows our consistency metric, which assesses the agreement of the data realization with the PPD.
Dark Energy Survey Year 6 Results: Galaxy-galaxy lensing
Authors: G. Giannini (giulia.giannini15@gmail.com) et al.
Link to paper: arXiv:2601.15175
We present galaxy–galaxy lensing (GGL) measurements from the first six years of data from the Dark Energy Survey (DES Y6), covering 4031 deg2 and used in the DES Y6 3x2pt cosmological analysis. We use the MagLim++ lens sample, containing ~9 million galaxies divided into six redshift bins, and the Metadetection source catalog, including ~140 million galaxies divided into four redshift bins. The mean tangential shear signal achieves a total signal-to-noise ratio (S/N) of 173, corresponding to a 17% improvement over DES Y3. After applying the scale cuts used in the cosmological analysis, with Rmin = 6 Mpc/h (4 Mpc/h) for the linear (nonlinear) galaxy-bias model, the S/N is reduced to 75 (90). A comprehensive suite of validation tests demonstrates that the measurement is robust against observational and astrophysical systematics at the statistical precision required for the DES Y6 analysis. Although not used in the main cosmological analysis, we extract high–signal-to-noise geometric shear-ratio measurements from the galaxy–galaxy lensing signal on small angular scales. These measurements provide an internal consistency check on the photometric redshift distributions and shear calibration parameters used in the 3x2pt analysis.
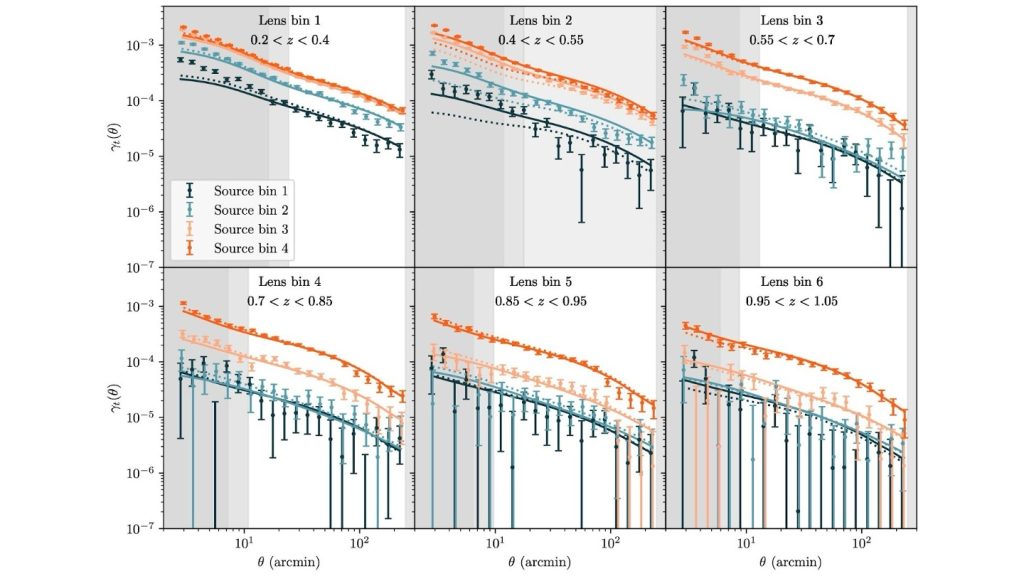
Figure: Tangential shear measurement for the 6 tomographic bins of MagLim++ and the 4 tomographic bins of \mdet. We overlay the best fit model for the linear bias case (solid lines) and for the nonlinear bias case (dashed lines). Gray shaded regions mark the angular scales removed from the analysis: darker gray for the linear bias scale cuts and lighter gray for the nonlinear bias cuts. Lens bin 2 is fully shaded because it is excluded from the fiducial data vector. Note that this figure does not illustrate the point-mass marginalization, which is applied during likelihood evaluation through the inverse covariance matrix and therefore cannot be represented in terms of the covariance elements shown here.
Dark Energy Survey Year 6 Results: Cosmological Constraints from Cosmic Shear
Authors: DES Collaboration et al.
Link to paper: https://arxiv.org/abs/2602.10065
This paper presents cosmic shear measurements and cosmological constraints from 150 million source galaxies from the final Dark Energy Survey dataset. The Year 6 data cover almost 5000 square degrees at 8.29 galaxies per square arcmin, representing one of the largest lensing datasets to date. In a blind analysis, we constrain the lensing amplitude parameter S_8 at the 2% level in LCDM. We assess the consistency of our results with a combination of modern CMB results from Planck 2018, ACT DR6 and SPT-3G DR1. Our data prefer a lower S_8 than these high-redshift measurements, although in the full parameter space they are consistent to within 2σ. The results are also in good qualitative agreement with contemporary lensing surveys (KiDS Legacy, HSC Y3, DECADE). We present a range of tests of internal consistency and data calibration, finding our analysis to be robust to these uncertainties. We finally test the impact of our choices around baryon feedback and intrinsic alignments. Here we find some sensitivity to both the choice of priors and mitigation approach, highlighting their importance for future cosmic shear analyses.
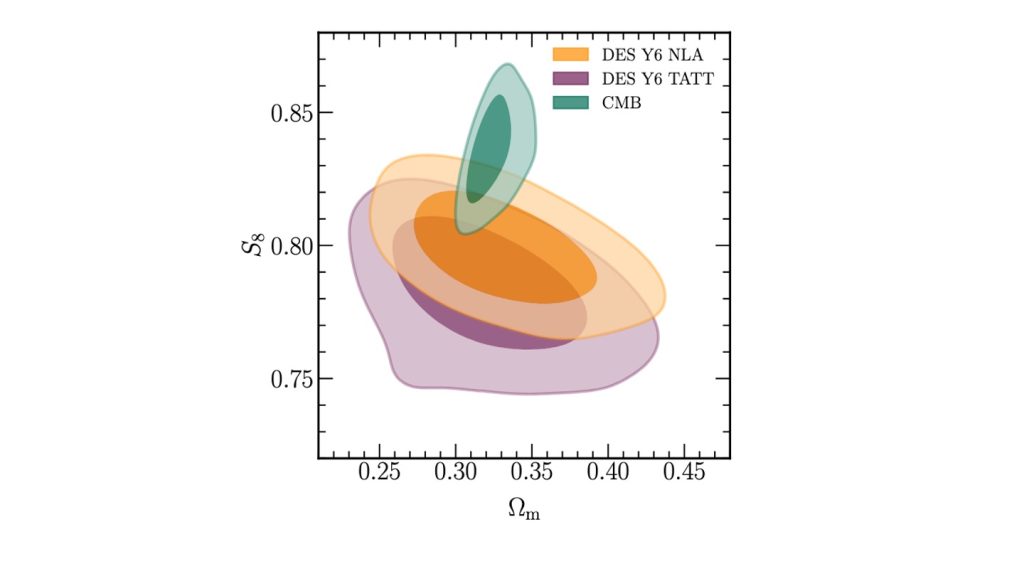
Figure: Posteriors on cosmological parameters from DES Y6 and a combination of CMB experiments (Planck 2018, ACT DR6 and SPT-3G, TT+TE+EE+lowE no lensing; green). The purple and orange contours show our fiducial results with two alternative models for intrinsic alignment (NLA and TATT). In the full parameter space, the difference between DES Y6 cosmic shear and the CMB is 1.1σ for NLA and 1.7σ for TATT.
Dark Energy Survey Year 6 Results: Cosmological Constraints from Galaxy Clustering and Galaxy-Galaxy Lensing
Authors: DES Collaboration (des-publication-queries@fnal.gov) et al.
Link to paper: TBD (in prep.)
Dark Energy Survey Year 6 Results: Cosmological Constraints from Galaxy Clustering and Weak Lensing
Authors: DES Collaboration (des-publication-queries@fnal.gov) et al.
Link to paper: arXiv:2601.14559
We present cosmology results combining galaxy clustering and weak gravitational lensing measured in the full six years (Y6) of observations by the Dark Energy Survey (DES) covering $\sim$5000\,deg$^2$. We perform a large-scale structure analysis using three two-point correlation functions (3$\times$2pt): (i) cosmic shear measuring correlations among the shapes of 140 million source galaxies, (ii) auto-correlations of the spatial distribution of 9 million lens galaxies, and (iii) galaxy–galaxy lensing from the cross-correlation between lens positions and source shapes. We find $S_8\equiv \sigma_8 (\Omega_{\rm m}/0.3)^{0.5} = 0.789^{+0.012}_{-0.012}$ and matter density $\Omega_{\rm m} = 0.333^{+0.023}_{-0.028}$ in $\Lambda$CDM (68\% CL), where $\sigma_8$ is the clustering amplitude. These constraints show a (full-space) parameter difference of 1.8$\sigma$ from a combination of cosmic microwave background (CMB) primary anisotropy datasets from {\it Planck} 2018, ACT-DR6, and SPT-3G DR1. For the first time, we also combine all DES dark-energy probes: 3$\times$2pt, SNe Ia, BAO and Clusters. A joint fit of Y6 3$\times$2, CMB, and external low-$z$ measurements produces the tightest $\Lambda$CDM constraints to date: $S_8 = 0.806^{+0.006}_{-0.007}$, $\Omega_{\rm m} = 0.302^{+0.003}_{-0.003}$, $h = 0.683^{+0.003}_{-0.002}$, and $\sum m_\nu < 0.14$ eV (95\% CL). In $w$CDM, this dataset combination yields $w = -0.981^{+0.021}_{-0.022}$, with no significant preference over $\Lambda$CDM.
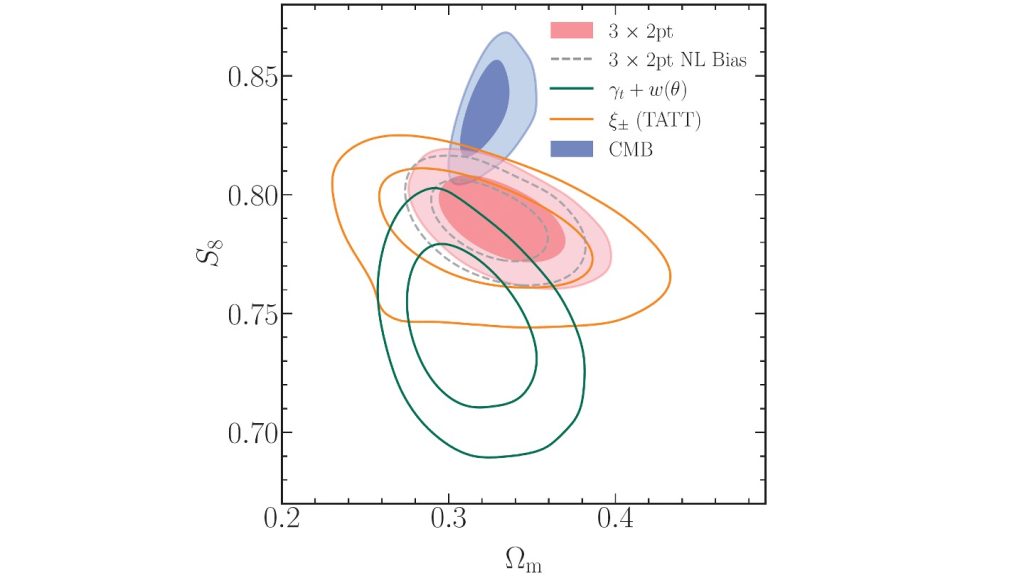
Figure: This figure shows the $\Omega_{\rm m}$-$S_8$ constraint from DES Y6 3x2pt assuming a flat $\Lambda$CDM model. We show the two components of 3x2pt: cosmic shear ($\xi_{\pm}$) and a combination of galaxy clustering and galaxy-galaxy lensing ($\gamma_t + w(\theta)$). We also show the 3x2pt constraints assuming nonlinear galaxy bias. When compared to constraints from the primary CMB, we find that our 3x2pt result is consistent with the CMB at the 1.8$\sigma$ level.
We’ve released some of the Y6 Cosmology data products on this page (more coming!): https://des.ncsa.illinois.edu/releases/y6a2/
For questions, you can email lead authors, or thedarkenergysurvey@gmail.com.
For a public-level overview of some of these papers, check out the the Darchives.